Triangles
Key Takeaway: Triangles contain five overlapping waves that subdivide 3-3-3-3-3 and are labeled A-B-C-D-E. See a triangle? Expect prices to first thrust – and then, reverse.
A triangle appears to reflect a balance of forces, causing a sideways movement that is usually associated with decreasing volume and volatility. The triangle pattern contains five overlapping waves that subdivide 3-3-3-3-3 and are labeled A-B-C-D-E. A triangle is delineated by connecting the termination points of waves A and C, and B and D. Wave E can undershoot or overshoot the A-C line, and in fact, our experience tells us that it happens more often than not.
Types of Triangles
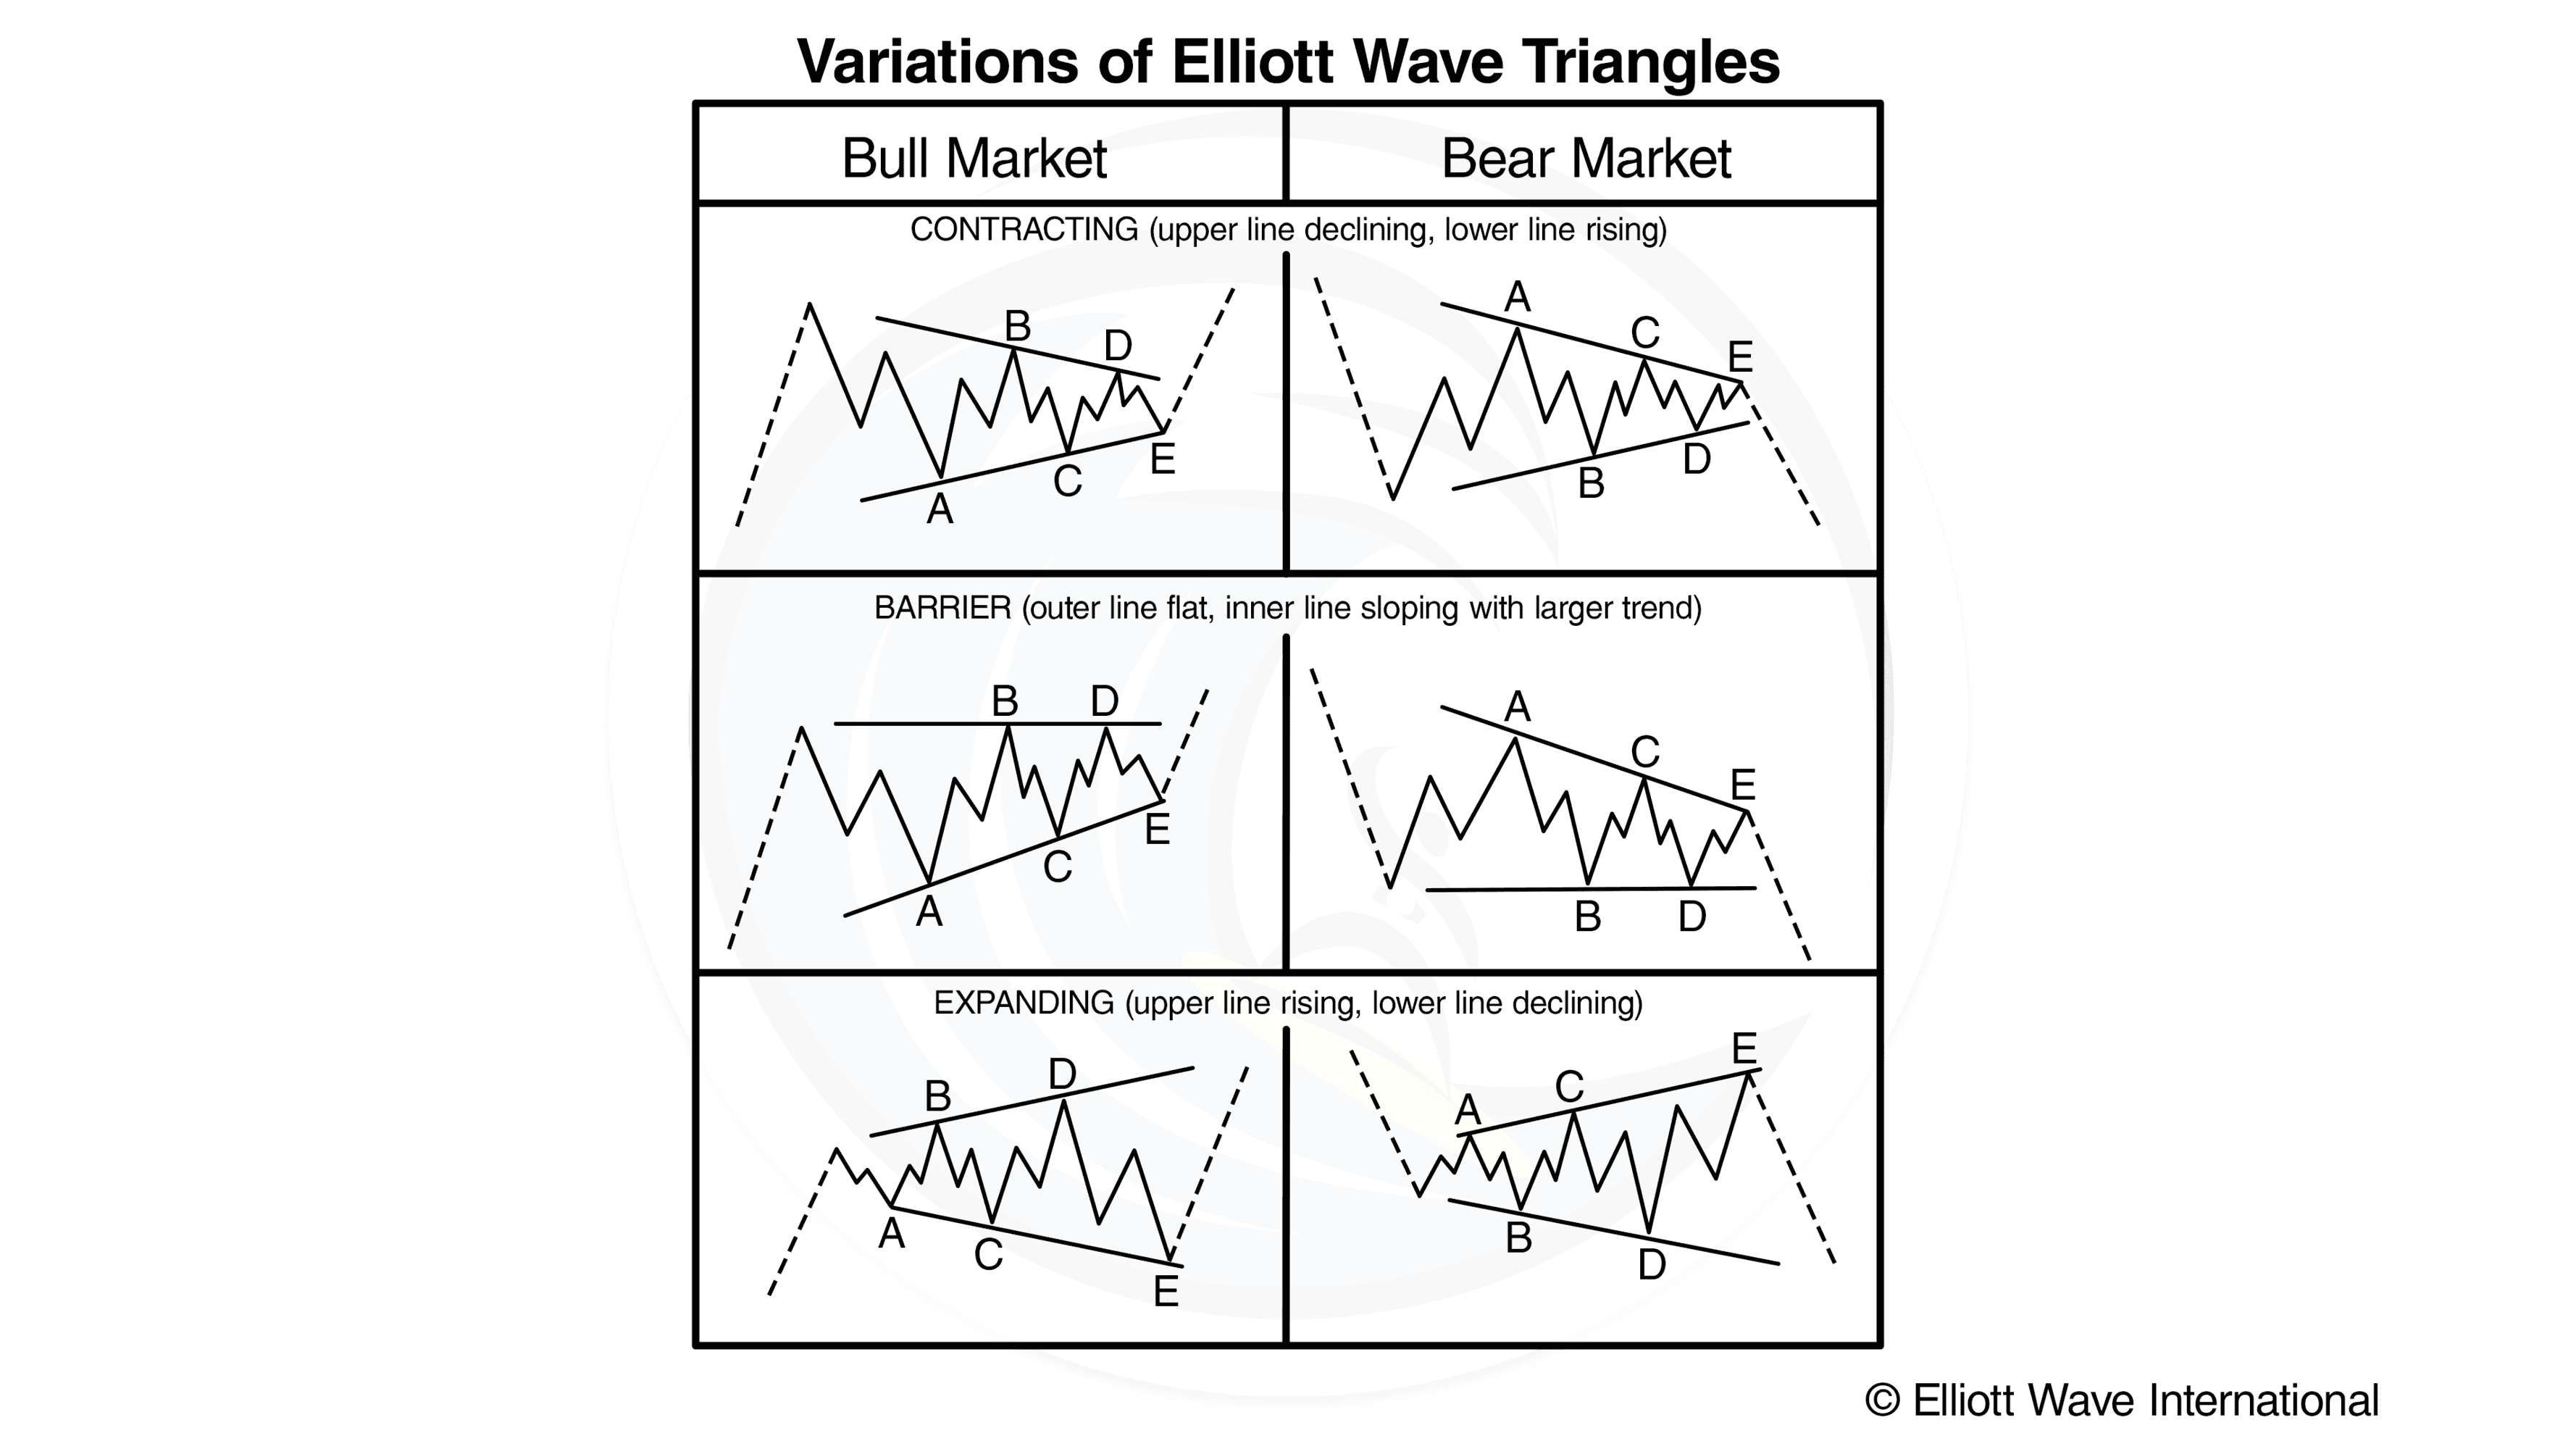
There are three varieties of triangles: contracting, barrier and expanding, as illustrated in Figure 1. Elliott contended that the horizontal line of a barrier triangle could occur on either side of the triangle, but such is not the case; it always occurs on the side that the next wave will exceed. Elliott’s terms, “ascending” and “descending,” are nevertheless useful shorthand in communicating whether the barrier triangle occurs in a bull or bear market, respectively.
Figure 1 depicts contracting and barrier triangles as taking place entirely within the area of preceding price action, which may be termed a regular triangle.
Yet, it is extremely common for wave B of a contracting triangle to exceed the start of wave A in what may be termed a running triangle, as shown in Figure 2.
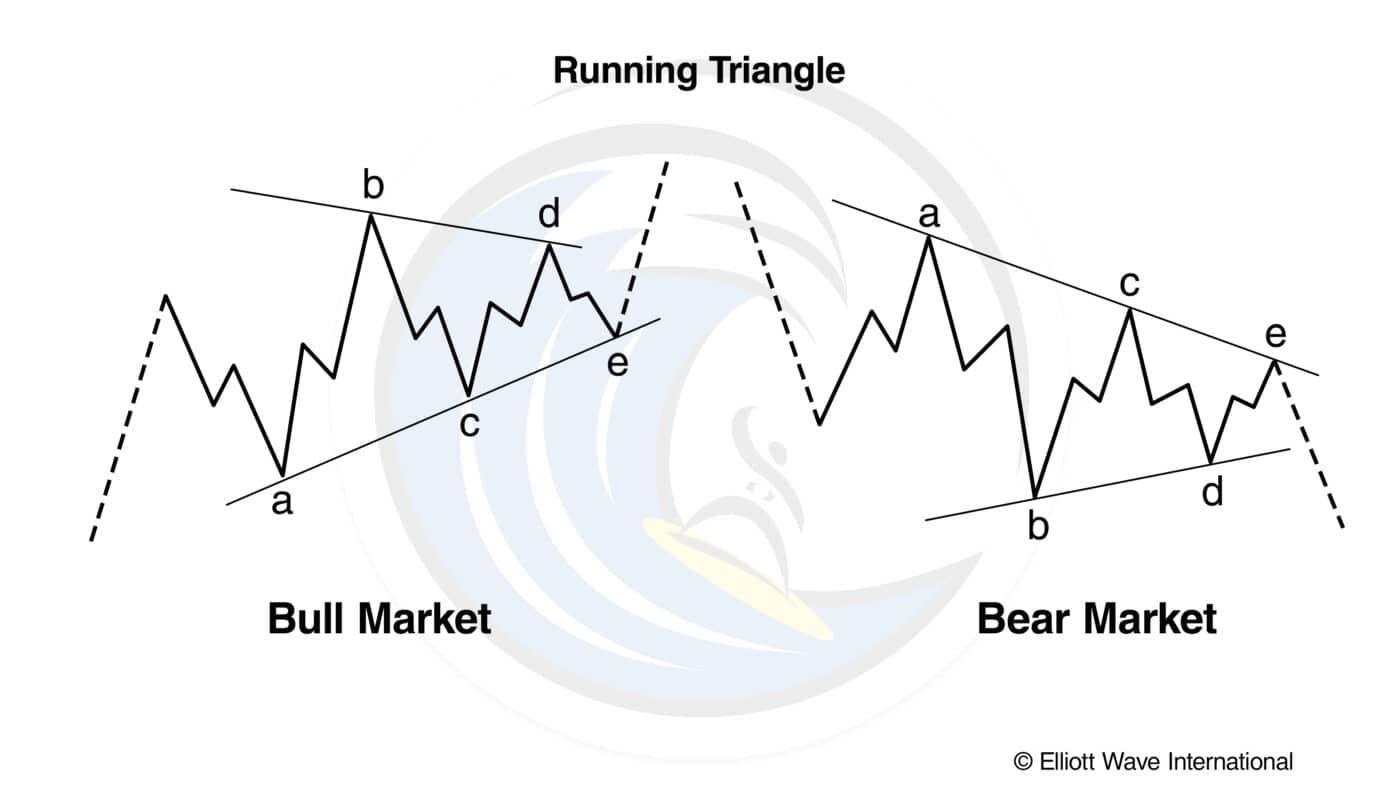
Despite their sideways appearance, all triangles, including running triangles, effect a net retracement of the preceding wave at wave E’s end.
Characteristics of Triangles
As you will notice, most of the subwaves in a triangle are zigzags, but sometimes one of the subwaves (usually wave C) is more complex than the others and can take the shape of a multiple zigzag. In rare cases, one of the sub-waves (usually wave E) is itself a triangle, so that the entire pattern protracts into nine waves. Thus, triangles, like zigzags, occasionally display a development that is analogous to an extension. One example occurred in silver from 1973 through 1977 (see Figure 3).
A triangle always occurs in a position prior to the final actionary wave in the pattern of one larger degree, i.e., as wave four in an impulse, wave B in an A-B-C, or the final wave X in a double or triple zigzag or combination (see “Combinations” entry). A triangle may also occur as the final actionary pattern in a corrective combination, although even then it usually precedes the final actionary wave in the pattern of one larger degree than the corrective combination. Although upon extremely rare occasions a second wave in an impulse appears to take the form of a triangle, it is usually due to the fact that a triangle is part of the correction, which is in fact a double three.
In the stock market, when a triangle occurs in the fourth wave position, wave five is sometimes swift and travels approximately the distance of the widest part of the triangle. Elliott used the word “thrust” in referring to this swift, short motive wave following a triangle. The thrust is usually an impulse but can be an ending diagonal. In powerful markets, there is no thrust, but instead a prolonged fifth wave. So if a fifth wave following a triangle pushes past a normal thrust movement, it is signaling a likely protracted wave. Post-triangle advancing impulses in commodities at degrees above Intermediate are usually the longest wave in the sequence.
Many analysts are fooled into labeling a completed triangle way too early. Triangles take time and go sideways. If you examine Figure 3 closely, you will see that one could have jumped the gun in the middle of wave b, pronouncing the end of five contracting waves. But the boundary lines of triangles almost never collapse so quickly. Subwave C is typically a complex wave, though wave B or D can fulfill that role. Give triangles time to develop.
On the basis of our experience with triangles, we propose that often the time at which the boundary lines of a contracting triangle reach an apex coincides with a turning point in the market. Perhaps the frequency of this occurrence would justify its inclusion among the guidelines associated with the Wave Principle.
“So wait… I can really learn to predict the markets?”
Yes. Markets aren’t rational. For every action, there isn’t always an equal and opposite reaction.
What drives prices isn’t logic, but emotion. Market emotions unfold in predictable patterns called Elliott waves. That’s what makes prices predictable.
What you just read is from the Wall Street bestseller, “Elliott Wave Principle: Key to Market Behavior.” For 40+ years, it’s been a top-shelf book on unbiased market analysis.
Amazon reviewers call it “classic and essential” and “the bible of the theory.” Now, you can get instant, FREE access to the full online version of this book ($29 value).