Promotional Videos & Articles
Browse our latest promotional videos & articles.
-

What’s Driving the Demand for Small Cars?
The current theme of the U.S. auto industry? Sales of small cars are driving big SUVs off the road. Fasten your seatbelt and let’s go.
-

Wave Five Breakout in SMH: Finding Setups in Real Time Using EWAVES
EWI’s Flash analyst reveals how EWAVES Wave Finder filtered more than 18,000 markets to flag a wave five breakout in VanEck Semiconductor ETF (SMH). You’ll see the setup exactly as it appeared in real time — and what happened next.
-
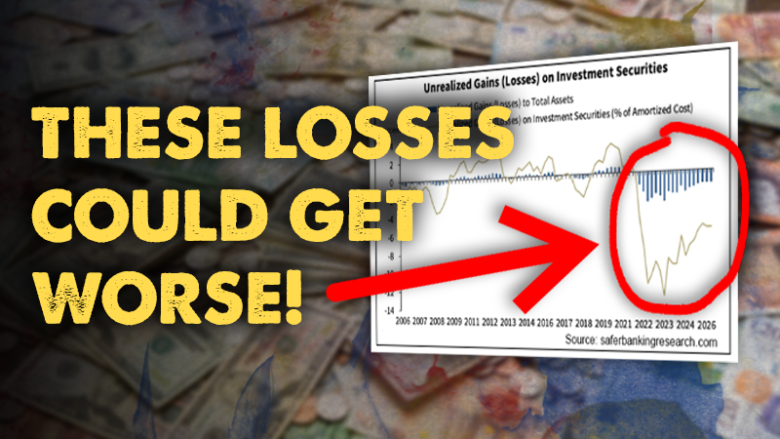
What Higher Interest Rates Are Doing to America’s Banks
Higher interest rates have left U.S. banks facing a problem that hasn’t gone away. See what Robert Prechter is watching — and why what happens next with rates could matter.
-
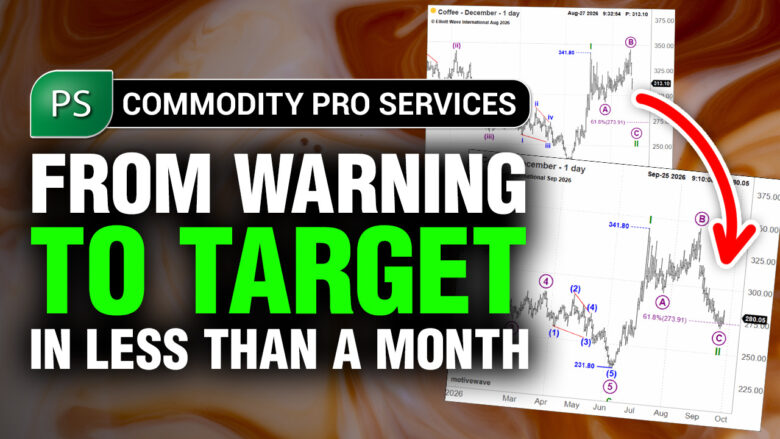
Martens’ Coffee Forecast – Switch from caffeinated to decaf pays off!
Commodity Pro Service editor Jim Martens saw trouble brewing in coffee. Weeks later, his downside target was hit after a 12.6% decline. See what he spotted.
-
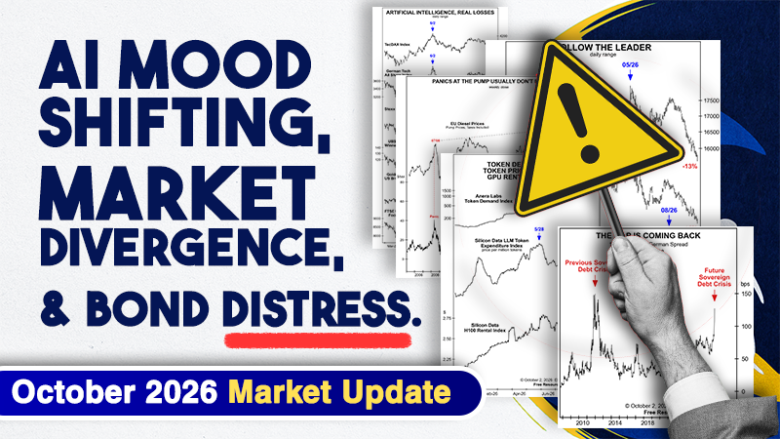
These Market Signals Are Getting Harder to Ignore
Three EWI analysts share what they’re seeing beneath the surface of today’s global markets — and the signals they believe investors should be watching now.
-
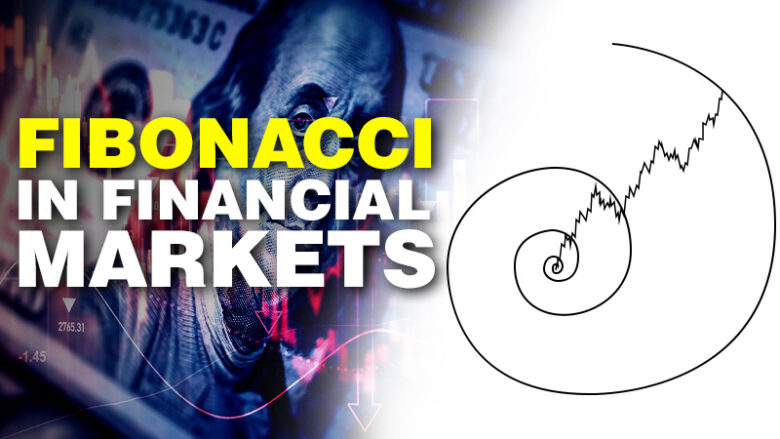
Elliott Waves Often Relate to Each Other Via the Fibonacci Sequence
Many investors may not realize how often the Fibonacci sequence of numbers shows up in the price patterns of financial markets. Here are two examples.
-
If the Federal Reserve Board is So Smart, I’d Hate to See What Dumb Looks Like!
The federal government is now spending about $1.25 trillion a year just to pay interest on the $40 trillion national debt. How did we get here?
-
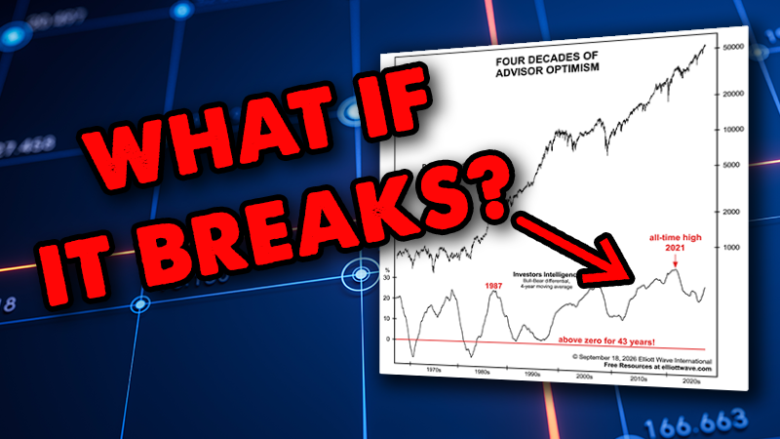
Even the 2008 Crash Couldn’t Break This 43-Year Streak
A stock market sentiment streak has survived every major market decline for 43 years — including the 1987 crash, the dot-com collapse and the 2008 financial crisis. Now, Robert Prechter is watching an important change.
-
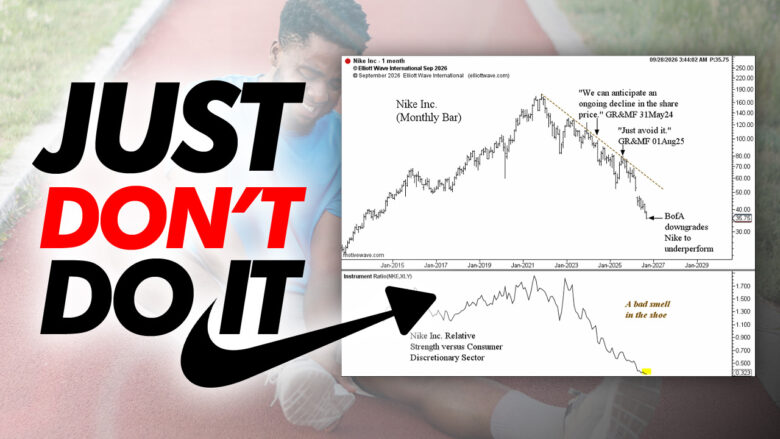
NIKE: Just DON’T Do It
Nike has fallen sharply since Global Rates & Money Flows editor Murray Gunn first warned subscribers in May 2024. See what his Elliott wave and relative strength analysis was signaling well before Wall Street’s latest downgrade.
-
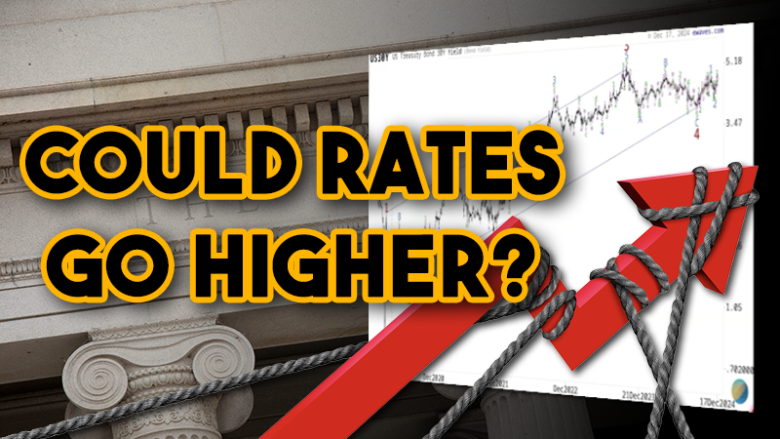
Interest Rates Are Surging. What’s Next?
Long-term interest rates are back in the headlines — but EWAVES anticipated the move nearly two years ago. See the Elliott wave pattern behind that forecast and what it may be signaling for Treasury yields now.
-

Feed It and Weep
Gas prices. The Economy. Public education. What issue is pushing its way to the top of the 2026 mid-term election campaign? Try… food safety.
-

The Last Time the Housing Market Topped
U.S. home prices peaked in 2006, then fell into the deepest crater since 1933. Here’s how Elliott Wave International prepared subscribers before real estate’s swift decline.
-
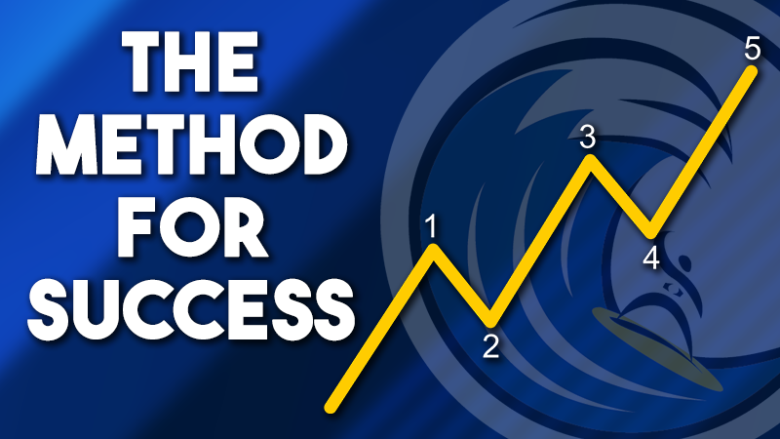
What Every Trader Really Needs to be Successful: A Method
After winning the U.S. Trading Championship with a then-record 444% return, Robert Prechter was asked for his trading tips. His response? Not a list of trades, but a fundamental rule: Every trader needs an objectively definable method.
-
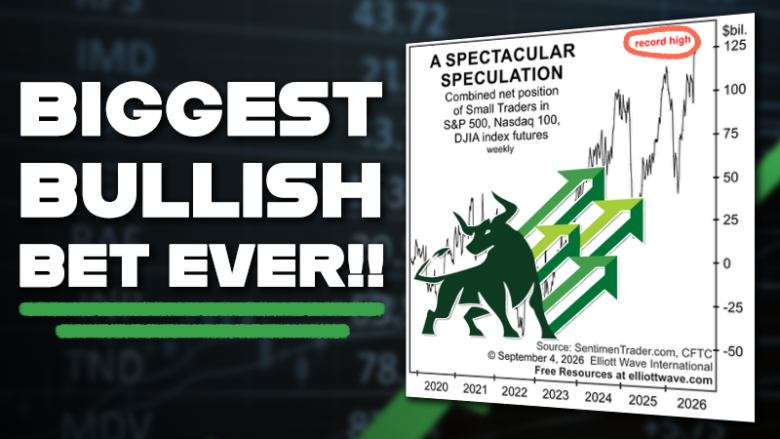
Small Traders Have Never Been This Bullish
Small Traders have made their largest bullish futures bet on record. See how this historic sentiment extreme compares with previous market peaks — and what other signs of investor confidence are revealing now.
-

A Stomach-Turning Issue!
Welcome to the summer of food recall whack-a-mole: you think one household staple is safe, only for it to be contaminated. Our new October Socionomist sinks its teeth into why.
-
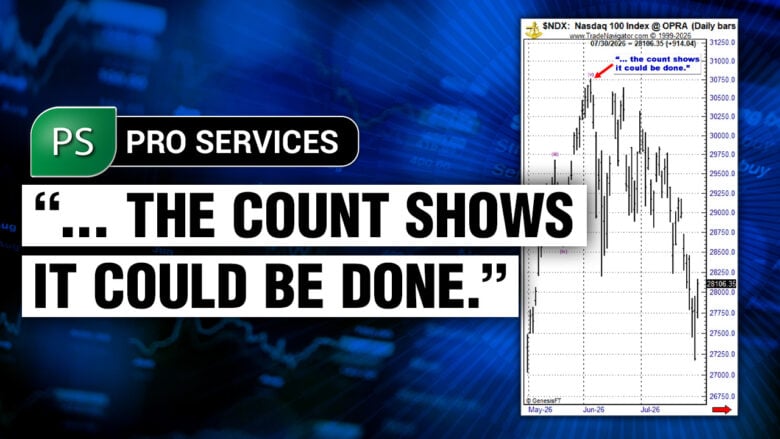
Pro Services Spotted the Nasdaq 100 Top Before a 12% Decline
At the Nasdaq 100’s June record high, EWI’s U.S. Stocks Pro Service identified an Elliott wave pattern warning of a potential reversal. See what happened before the index fell 12%.
-

Cattle Prices Are Falling. What Happens Next?
Live cattle prices have fallen sharply from their June highs. See how Elliott wave analysis anticipated a major cattle move in 2020 — and why today’s market may be worth watching closely.
-

Countersurveillance Chic
When it comes to high fashion, the name of the game is usually about standing out and being seen. That was until the wrong set of eyes started watching.
-
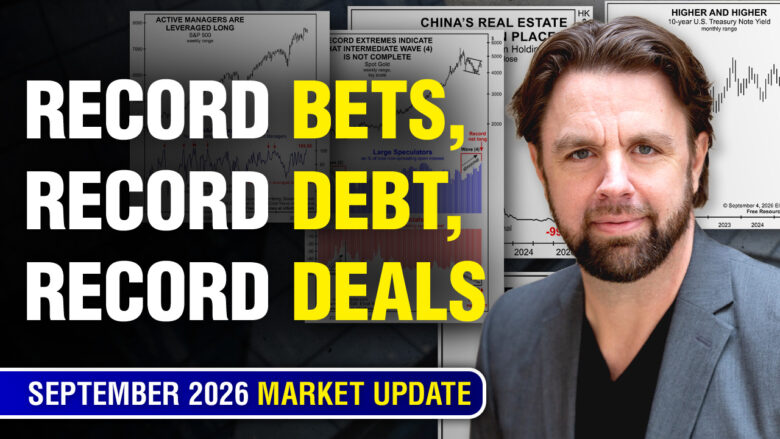
Record Bets, Record Debt, Record Deals: 8 Charts to Watch Right Now
In this collection of video clips, Brian Whitmer walks through eight charts shaping the global outlook. Active managers are leveraged long while small traders hold a record $130 billion net long position in stock index futures. Gold’s insiders are record net short. U.S. interest expense has passed the defense budget. Plus China’s property collapse, Klarna and the German consumer, the euro’s three-wave rallies, and what a $12.5 billion Lakers sale says about the trend.
-

A Whole New Level of Loneliness
If you’re feeling sad and lonely, don’t blame technology! There’s another reason you might not have thought of.
-
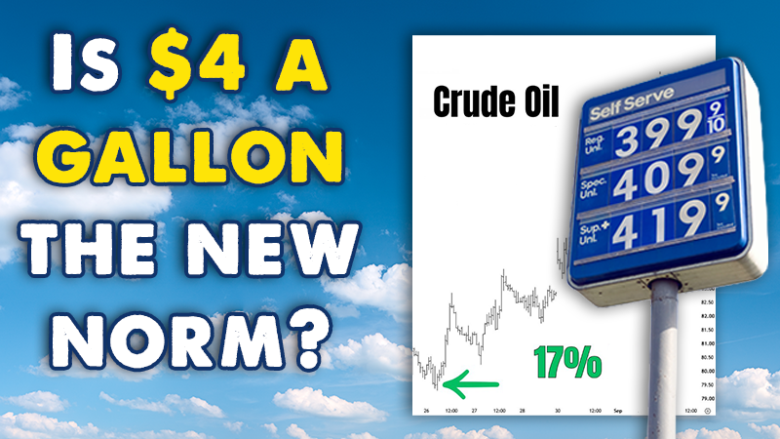
Will Venezuelan Oil Send Crude Prices Lower?
With Venezuelan oil dominating the headlines, what could more supply mean for crude prices? See how Elliott wave analysis helped EWI navigate key turns before the latest news.
-
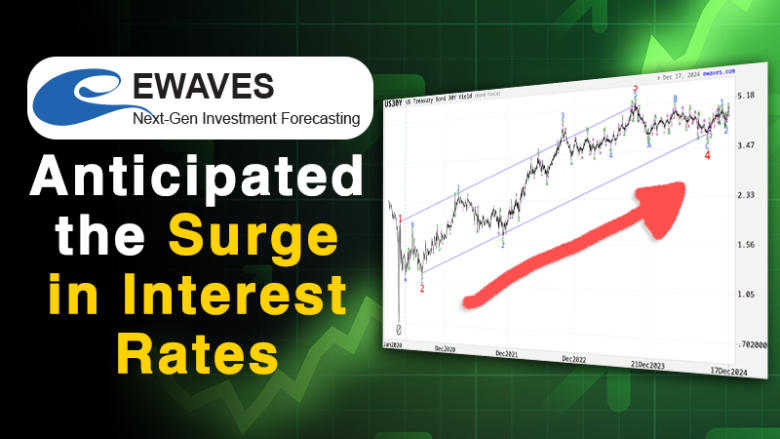
EWAVES Anticipated the Surge in Interest Rates
With long-term interest rates all over the news, it’s worth revisiting what EWAVES was saying before the latest surge began.
-
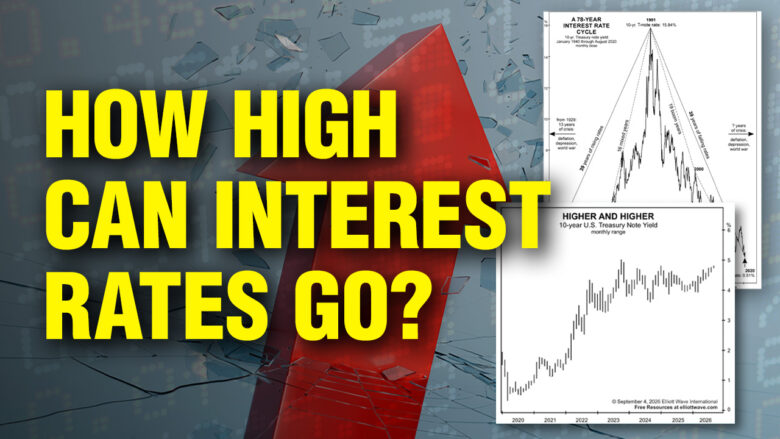
The U.S. Now Spends More on Interest Payments Than Defense
The U.S. government’s annual interest bill has climbed to $1.25 trillion as borrowing costs have moved higher. See the interest-rate call EWI made six years ago and what today’s bond market could be signaling now.
-
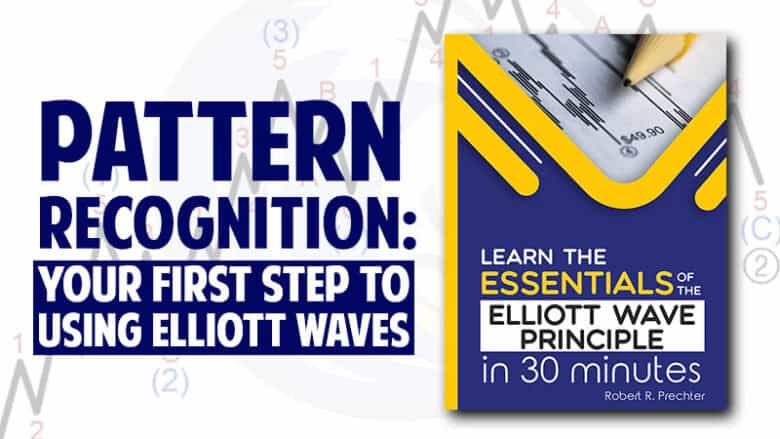
Pattern Recognition: Your First Step to Using Elliott Waves
This chart shows how the basic Elliott wave patterns build to form five- and three-wave structures of increasingly larger size (larger “degree,” as Elliott said). If you know where you are in the structure, you can anticipate what’s next.
-

Gold Is Back Above $4,400. Is the Next Big Move Beginning?
Gold has rallied back above $4,400—but has its next major move begun? See what EWI Chief Market Analyst Steven Hochberg is watching in gold’s Elliott wave pattern and investor sentiment.
-
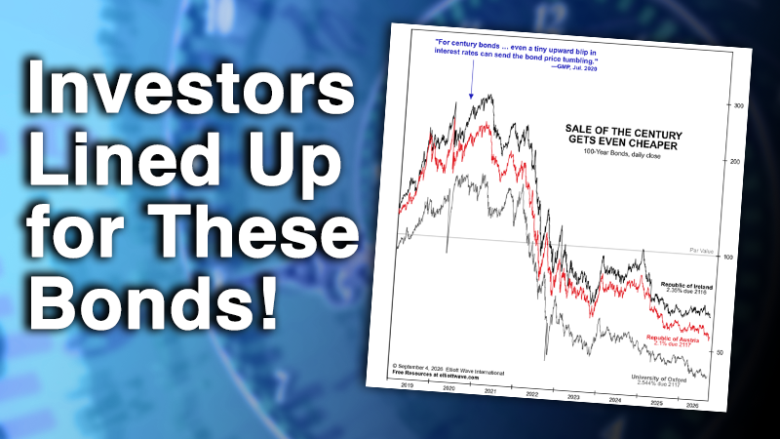
Investors Lined Up for These Bonds. GMP Warned About the Risk.
In 2020, investors rushed to buy 100-year bonds yielding less than 1%. Global Market Perspective warned about the risk. See what happened next—and what investors can learn from it today.
-
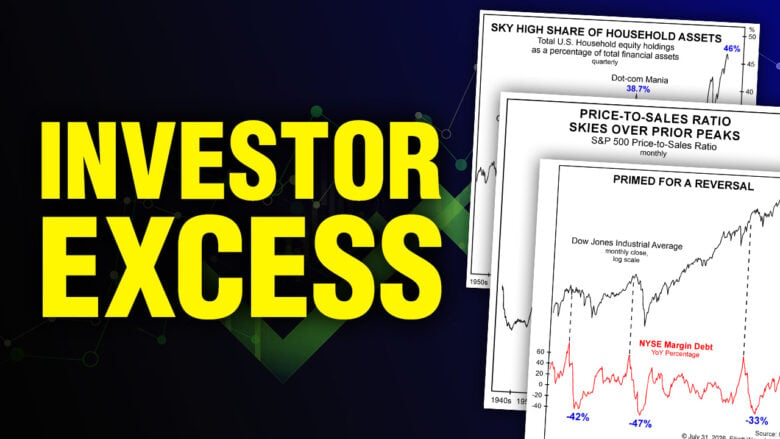
4 Signs of Excess in Today’s Stock Market
Investors have rarely been this heavily committed to stocks. From record valuations to unprecedented household exposure and rising margin debt, the evidence of excess is piling up. These charts are worth watching.
-

AI HAS A $570 BILLION PROBLEM
AI spending is soaring—but so is the debt behind it. In this video, we look beyond the excitement surrounding artificial intelligence to a $570 billion development that could be telling investors something important.
-

The Future of AI
Silicon Valley titans say AI will save us. Concerned citizens fear the opposite. Who is right?
-
A Common Assumption, Busted
Many investors believe that there’s a correlation between the price trends of stocks and crude oil. Let’s investigate.