Truncation
Key Takeaway: A truncation is the fifth wave in an impulsive pattern that fails to exceed the price extreme of the third wave. It suggests underlying strength or weakness and an impending market reversal.
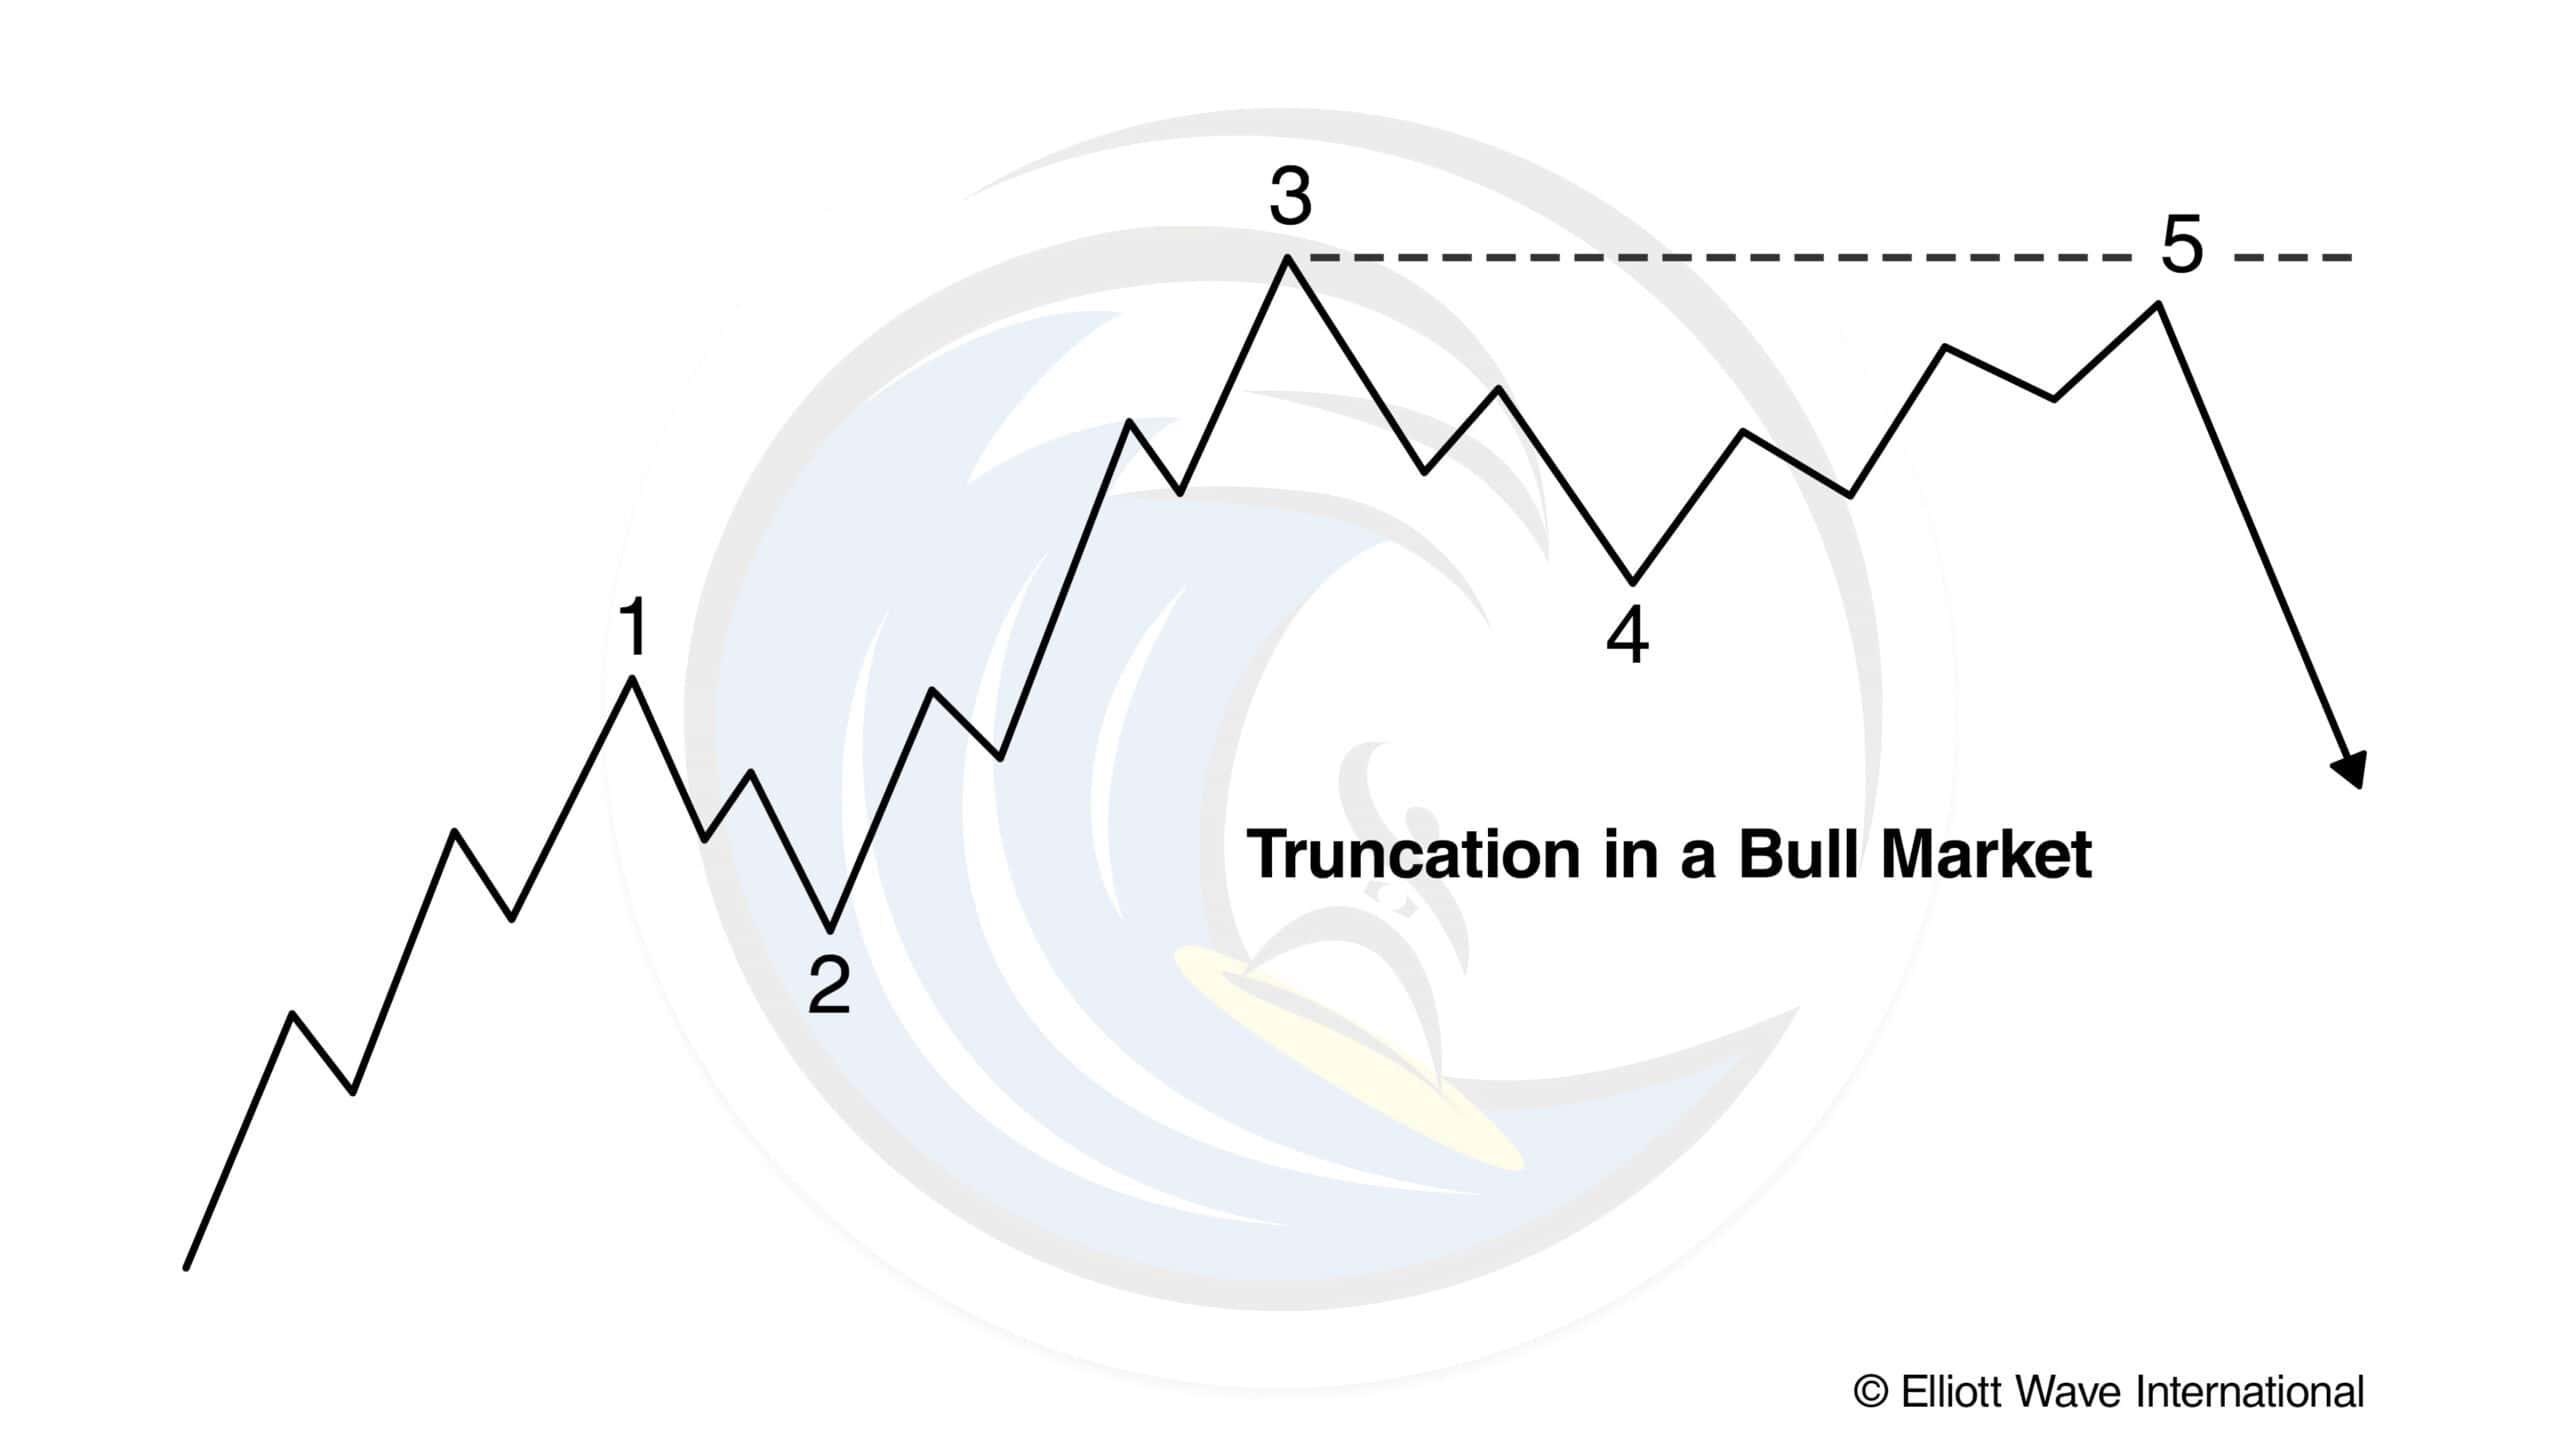
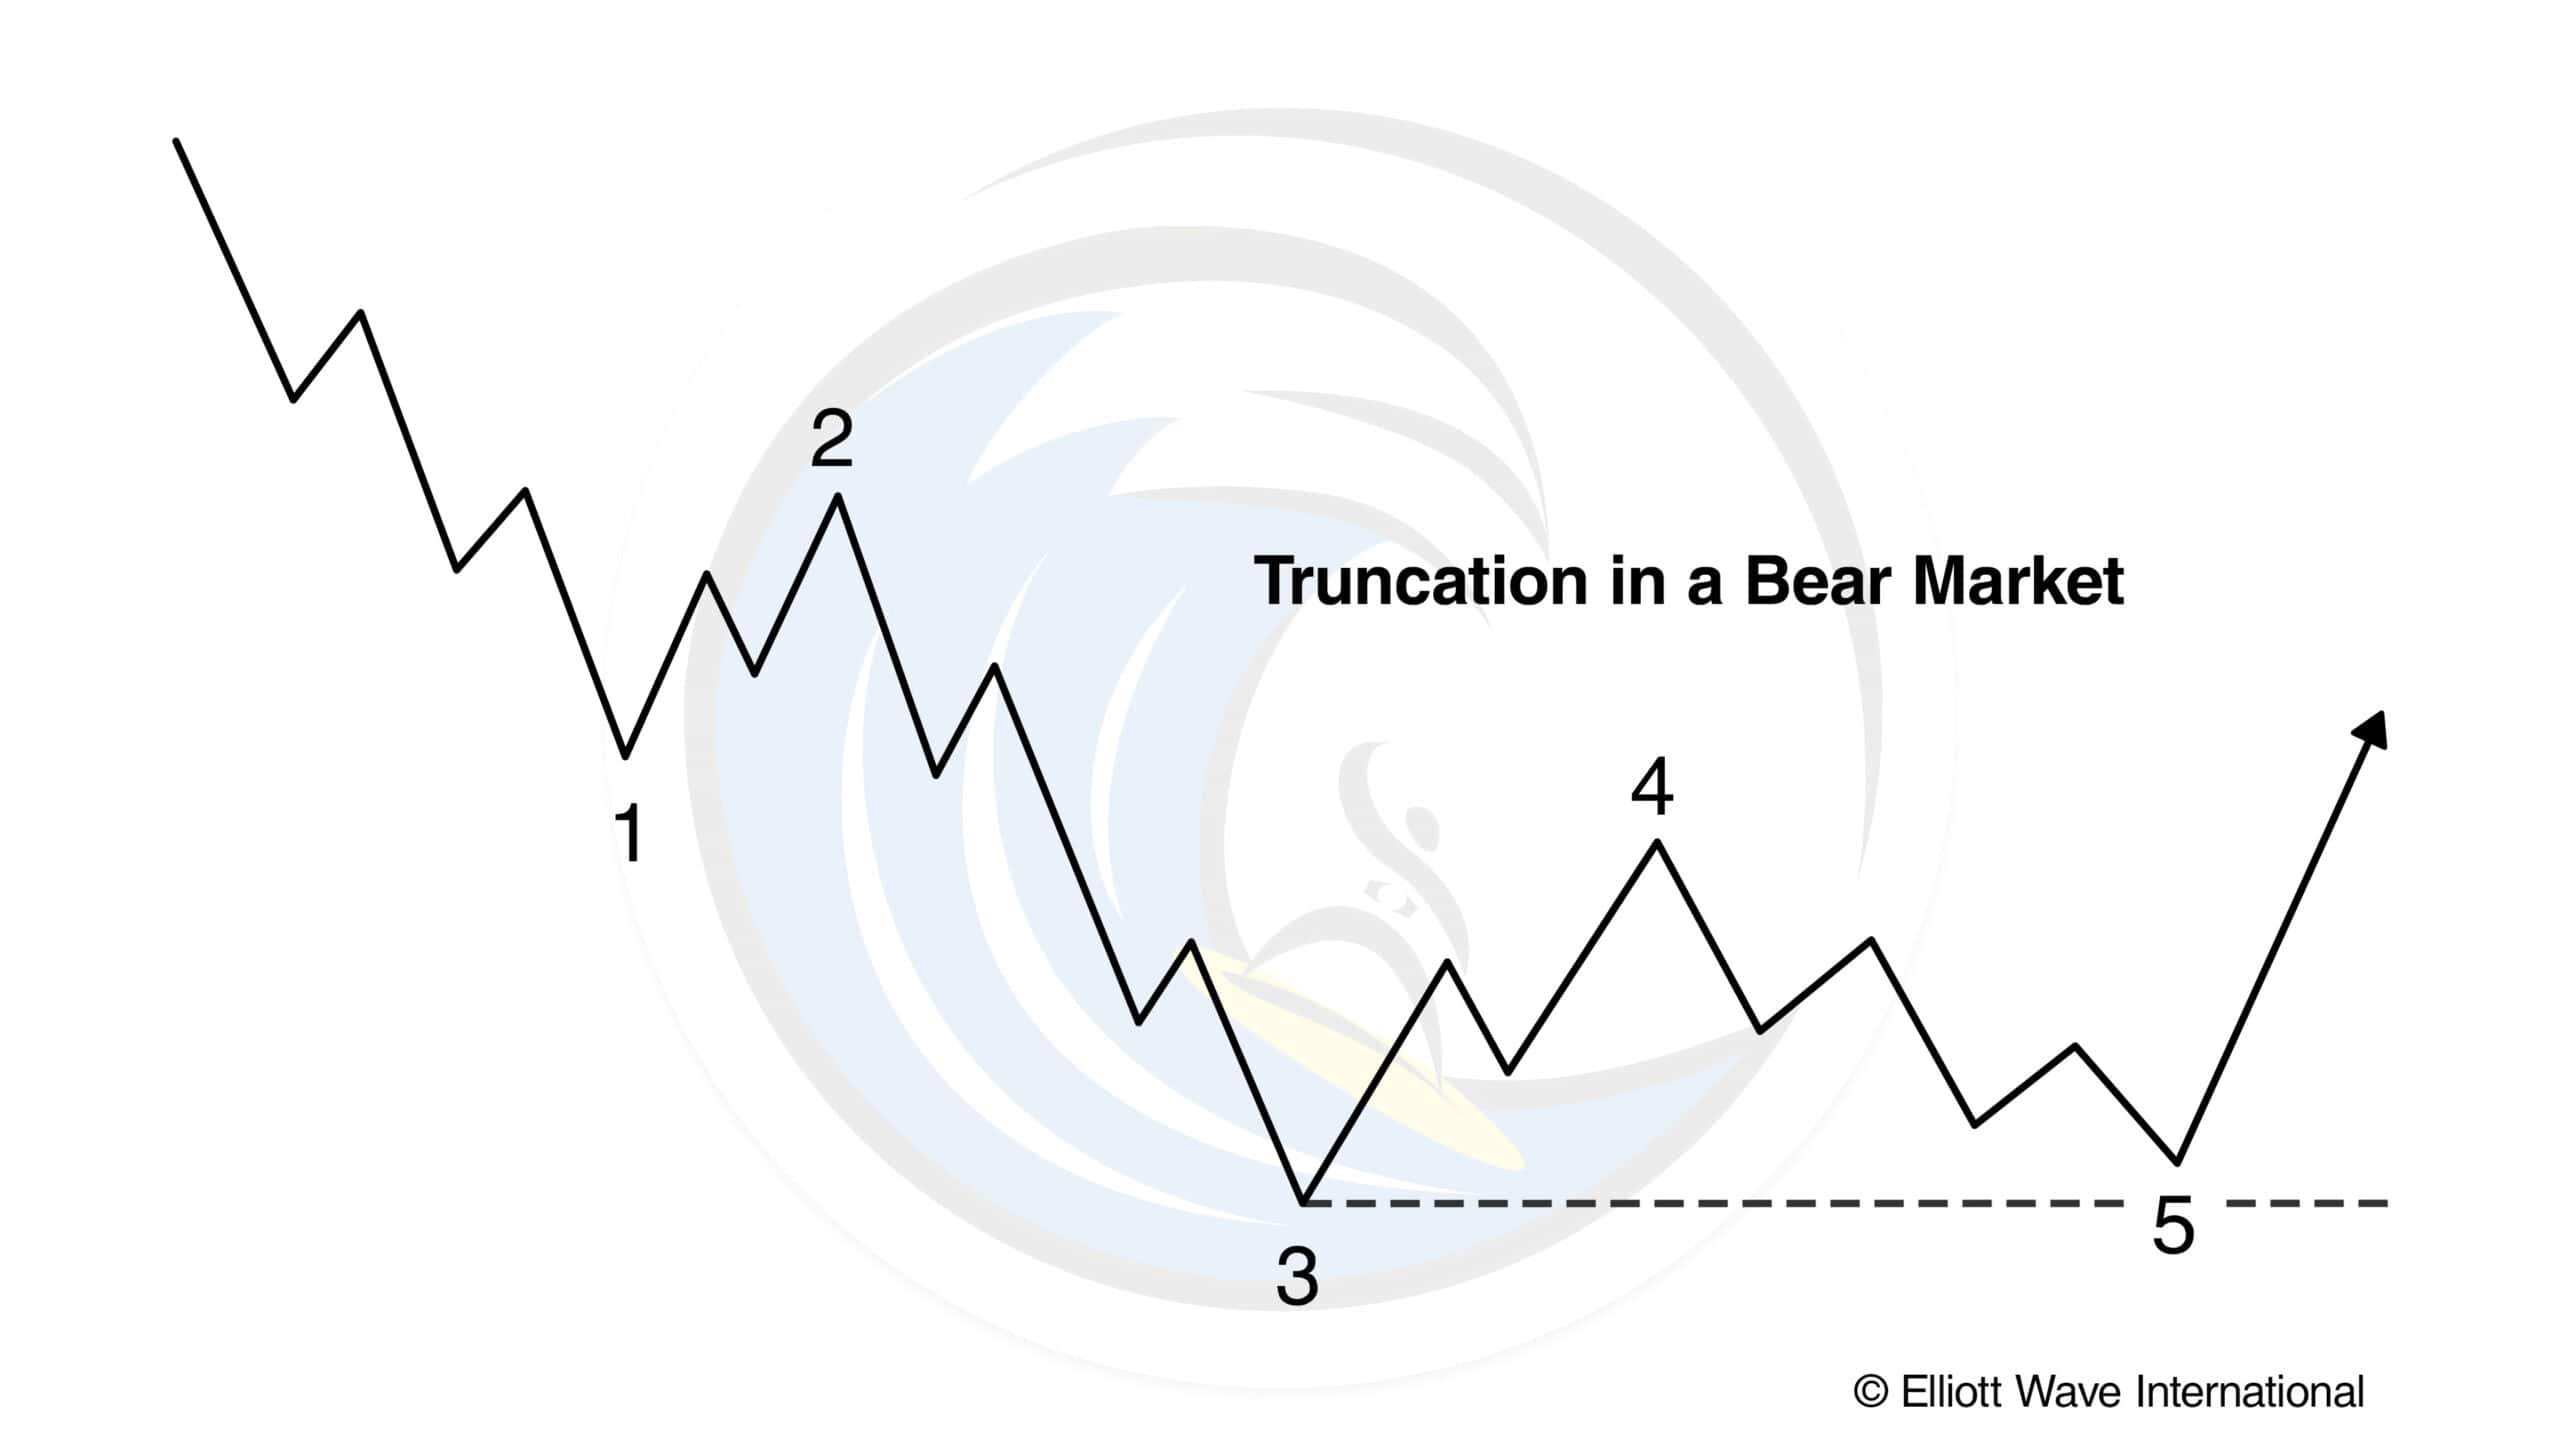
Elliott used the word “failure” to describe a situation in which the fifth wave does not move beyond the end of the third. We prefer the less connotative term, “truncation,” or “truncated fifth.” A truncation can usually be verified by noting that the presumed fifth wave contains the necessary five subwaves, as illustrated in Figures 1 and 2. A truncation often occurs following a particularly strong third wave.
The U.S. stock market provides two examples of major degree truncated fifths since 1932. The first occurred in October 1962 at the time of the Cuban crisis (see Figure 3). It followed the crash that occurred as wave 3.
The second occurred at yearend in 1976 (see Figure 4). It followed the soaring and broad wave (3) that took place from October 1975 to March 1976.
Truncation gives warning of underlying weakness or strength in the market. In application, a truncated fifth wave will often cut short an expected target. This annoyance is counterbalanced by its clear implications for persistence in the new direction of trend.
“So wait… I can really learn to predict the markets?”

Yes. Markets aren’t rational. For every action, there isn’t always an equal and opposite reaction.
What drives prices isn’t logic, but emotion. Market emotions unfold in predictable patterns called Elliott waves. That’s what makes prices predictable.
What you just read is from the Wall Street bestseller, “Elliott Wave Principle: Key to Market Behavior.” For 40+ years, it’s been a top-shelf book on unbiased market analysis.
Amazon reviewers call it “classic and essential” and “the bible of the theory.” Now, you can get instant, FREE access to the full online version of this book ($29 value).