Fibonacci Relationships
Key Takeaway: The Fibonacci sequence provides the mathematical basis of the Wave Principle. Elliott wave traders calculate Fibonacci price levels to help identify target zones and possible ending points for wave patterns. They are also frequently used for timing purposes.
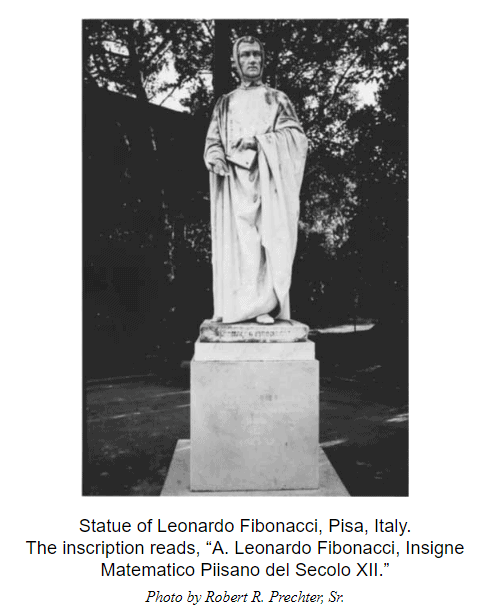
Fibonacci ratios are named for the famous 13th-century mathematician Leonardo Fibonacci of Pisa, the most important mathematician of the Middle Ages.
Fibonacci popularized the current decimal and Hindu-Arabic numbering systems. He also discovered (actually rediscovered) the numeric sequence that bears his name, the Fibonacci sequence — which begins with the number 1 and in which each subsequent number is the sum of the previous two: 1, 1, 2, 3, 5, 8, 13, 21, 34, 55, 89 and so on. The sequence in turn gives rise to several unique ratios, including .618, .382 and 1.618 — the Golden Ratio.
These ratios exist throughout nature, in everything from population growth to the physical structure within the human brain, the DNA helix, many plants and even the cosmos itself.
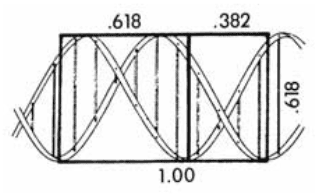
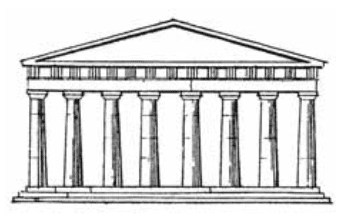
The Golden Ratio in DNA and in the classic beauty of the Parthenon
Fibonacci and Elliott waves
Many investors today know that Fibonacci ratios are used for market forecasting. But few realize that Fibonacci analysis of the markets was pioneered by R.N. Elliott. The use of Fibonacci ratios requires a valid Elliott wave interpretation as a starting point. Unfortunately, many non-Elliott analysts try to find Fibonacci proportions between market moves that are not related to each other in any way. This has made the approach appear far less valuable than it is.
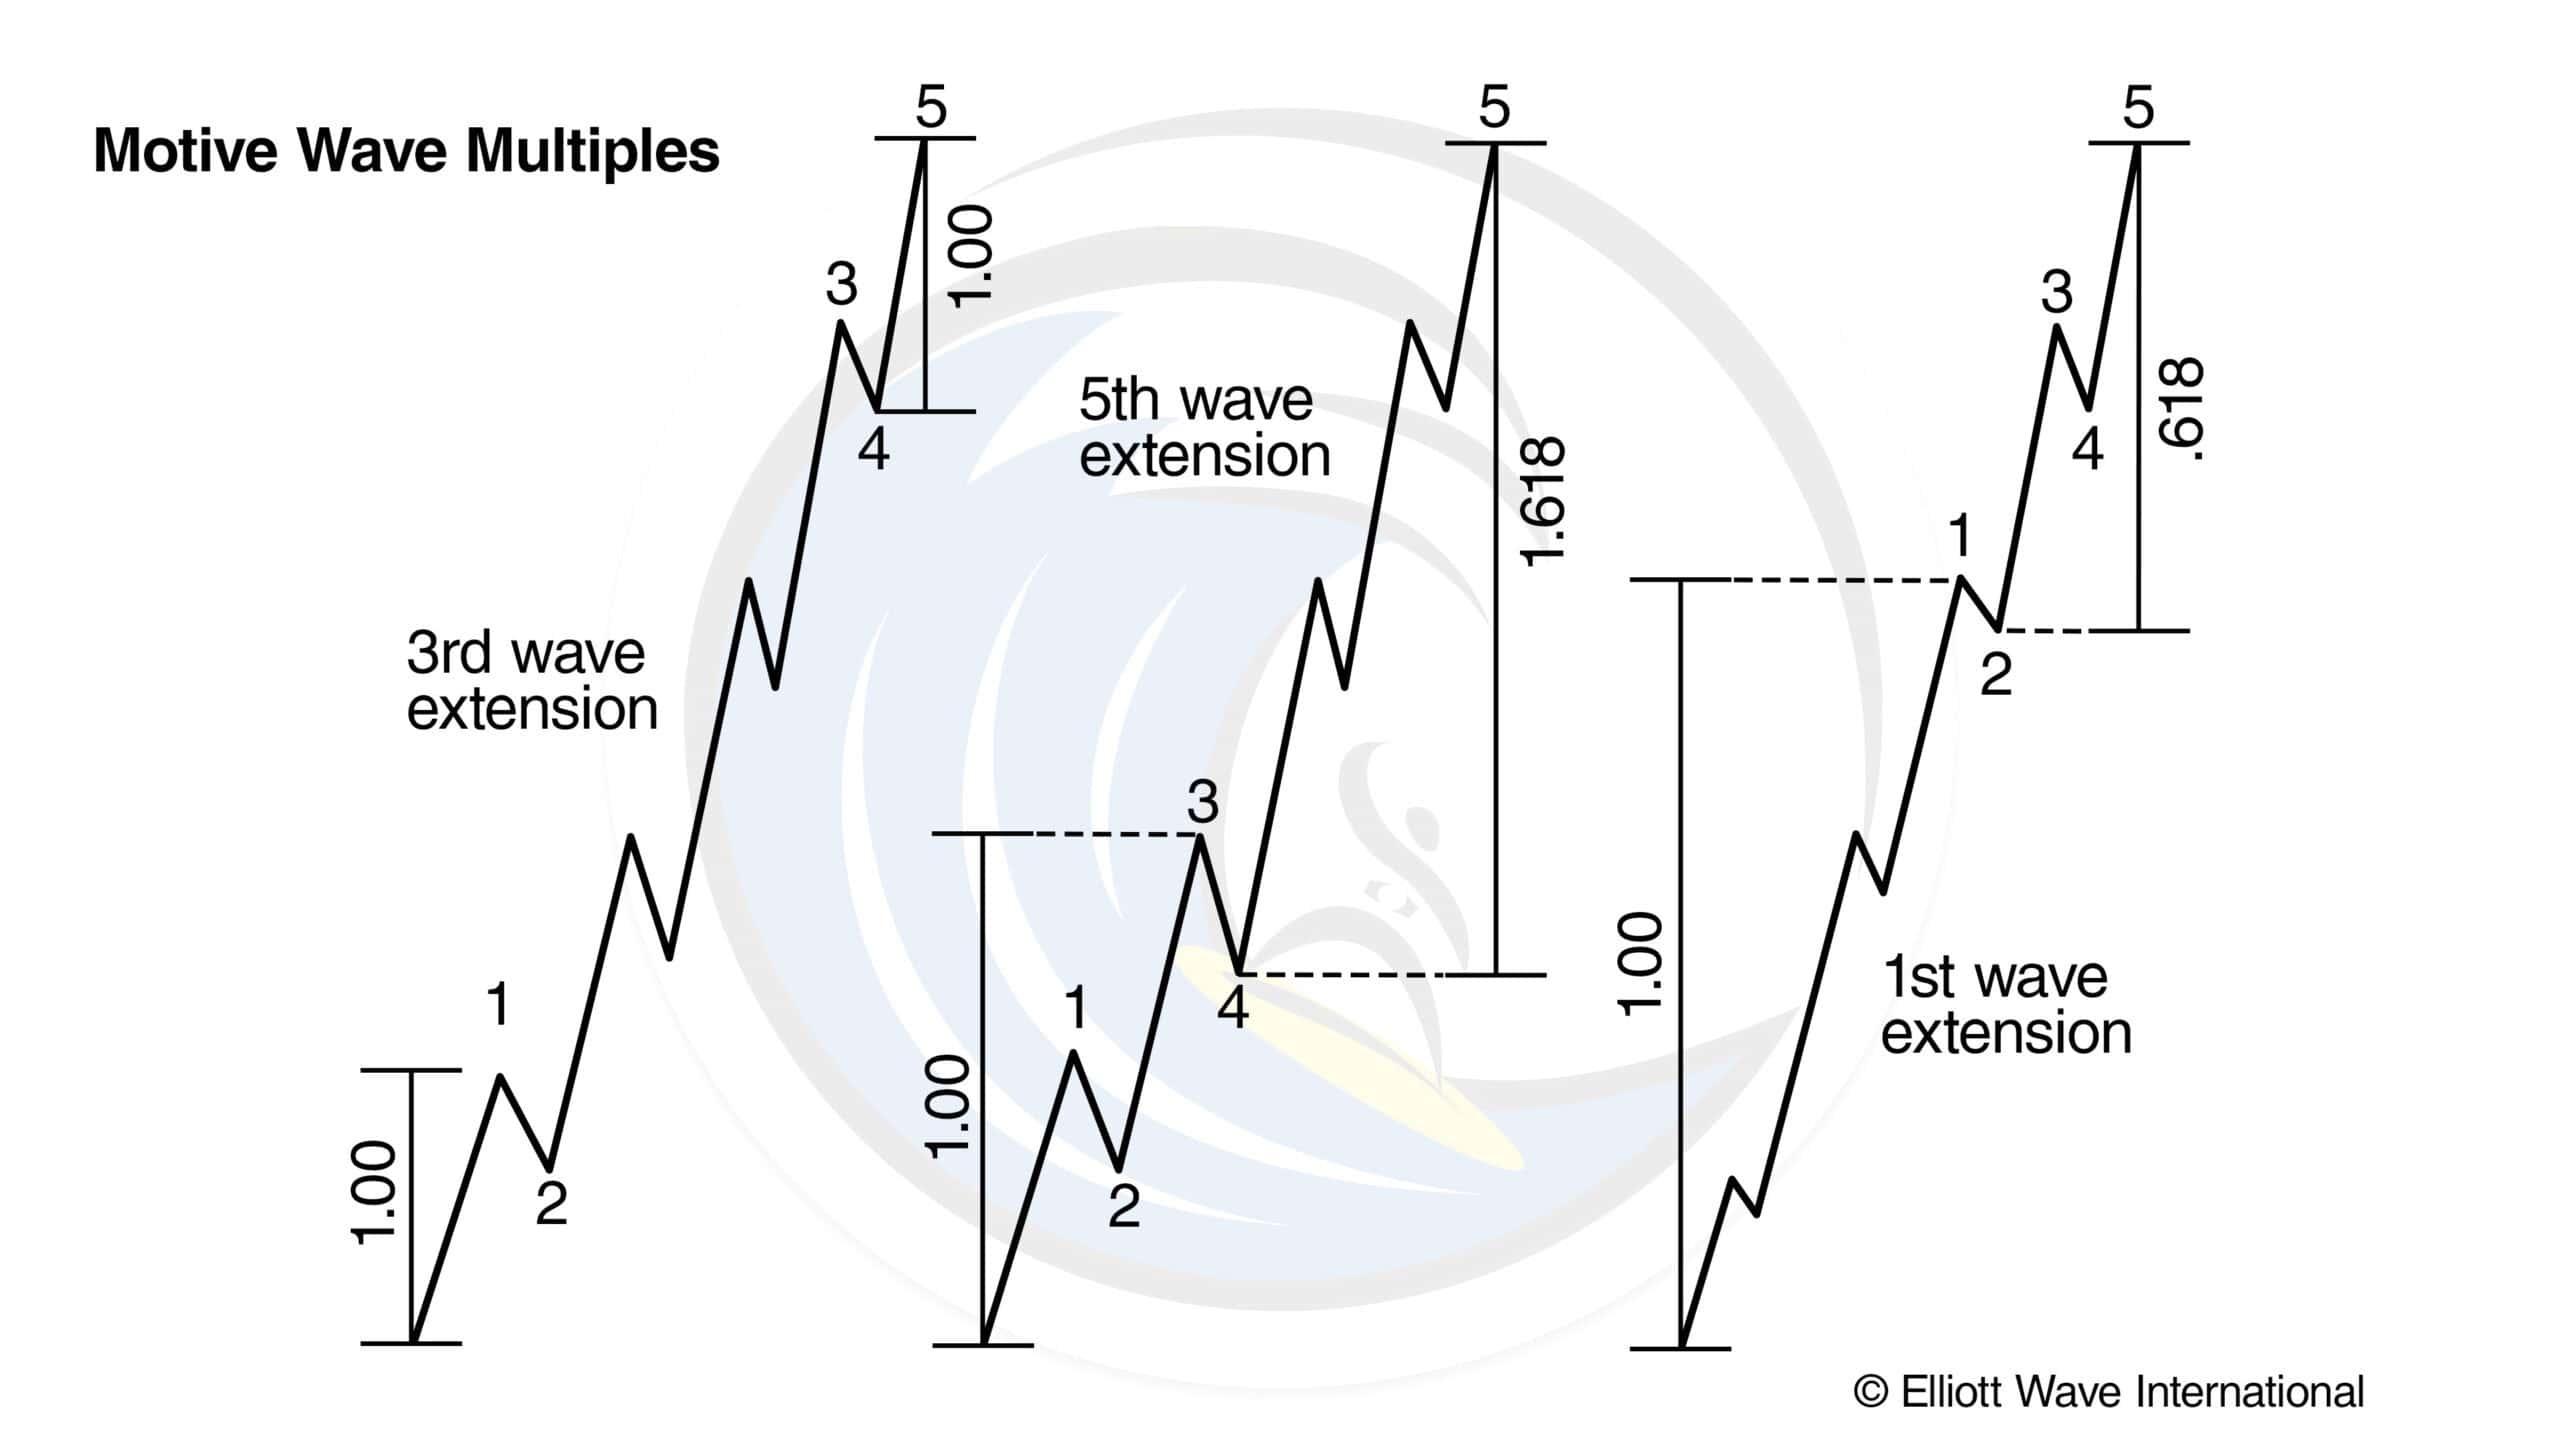
Elliott had two chief insights concerning Fibonacci relationships within waves. First, corrective waves tend to retrace prior impulse waves of the same degree in Fibonacci proportion. For example, wave (2) in Figure 1 retraces 38% of wave (1).
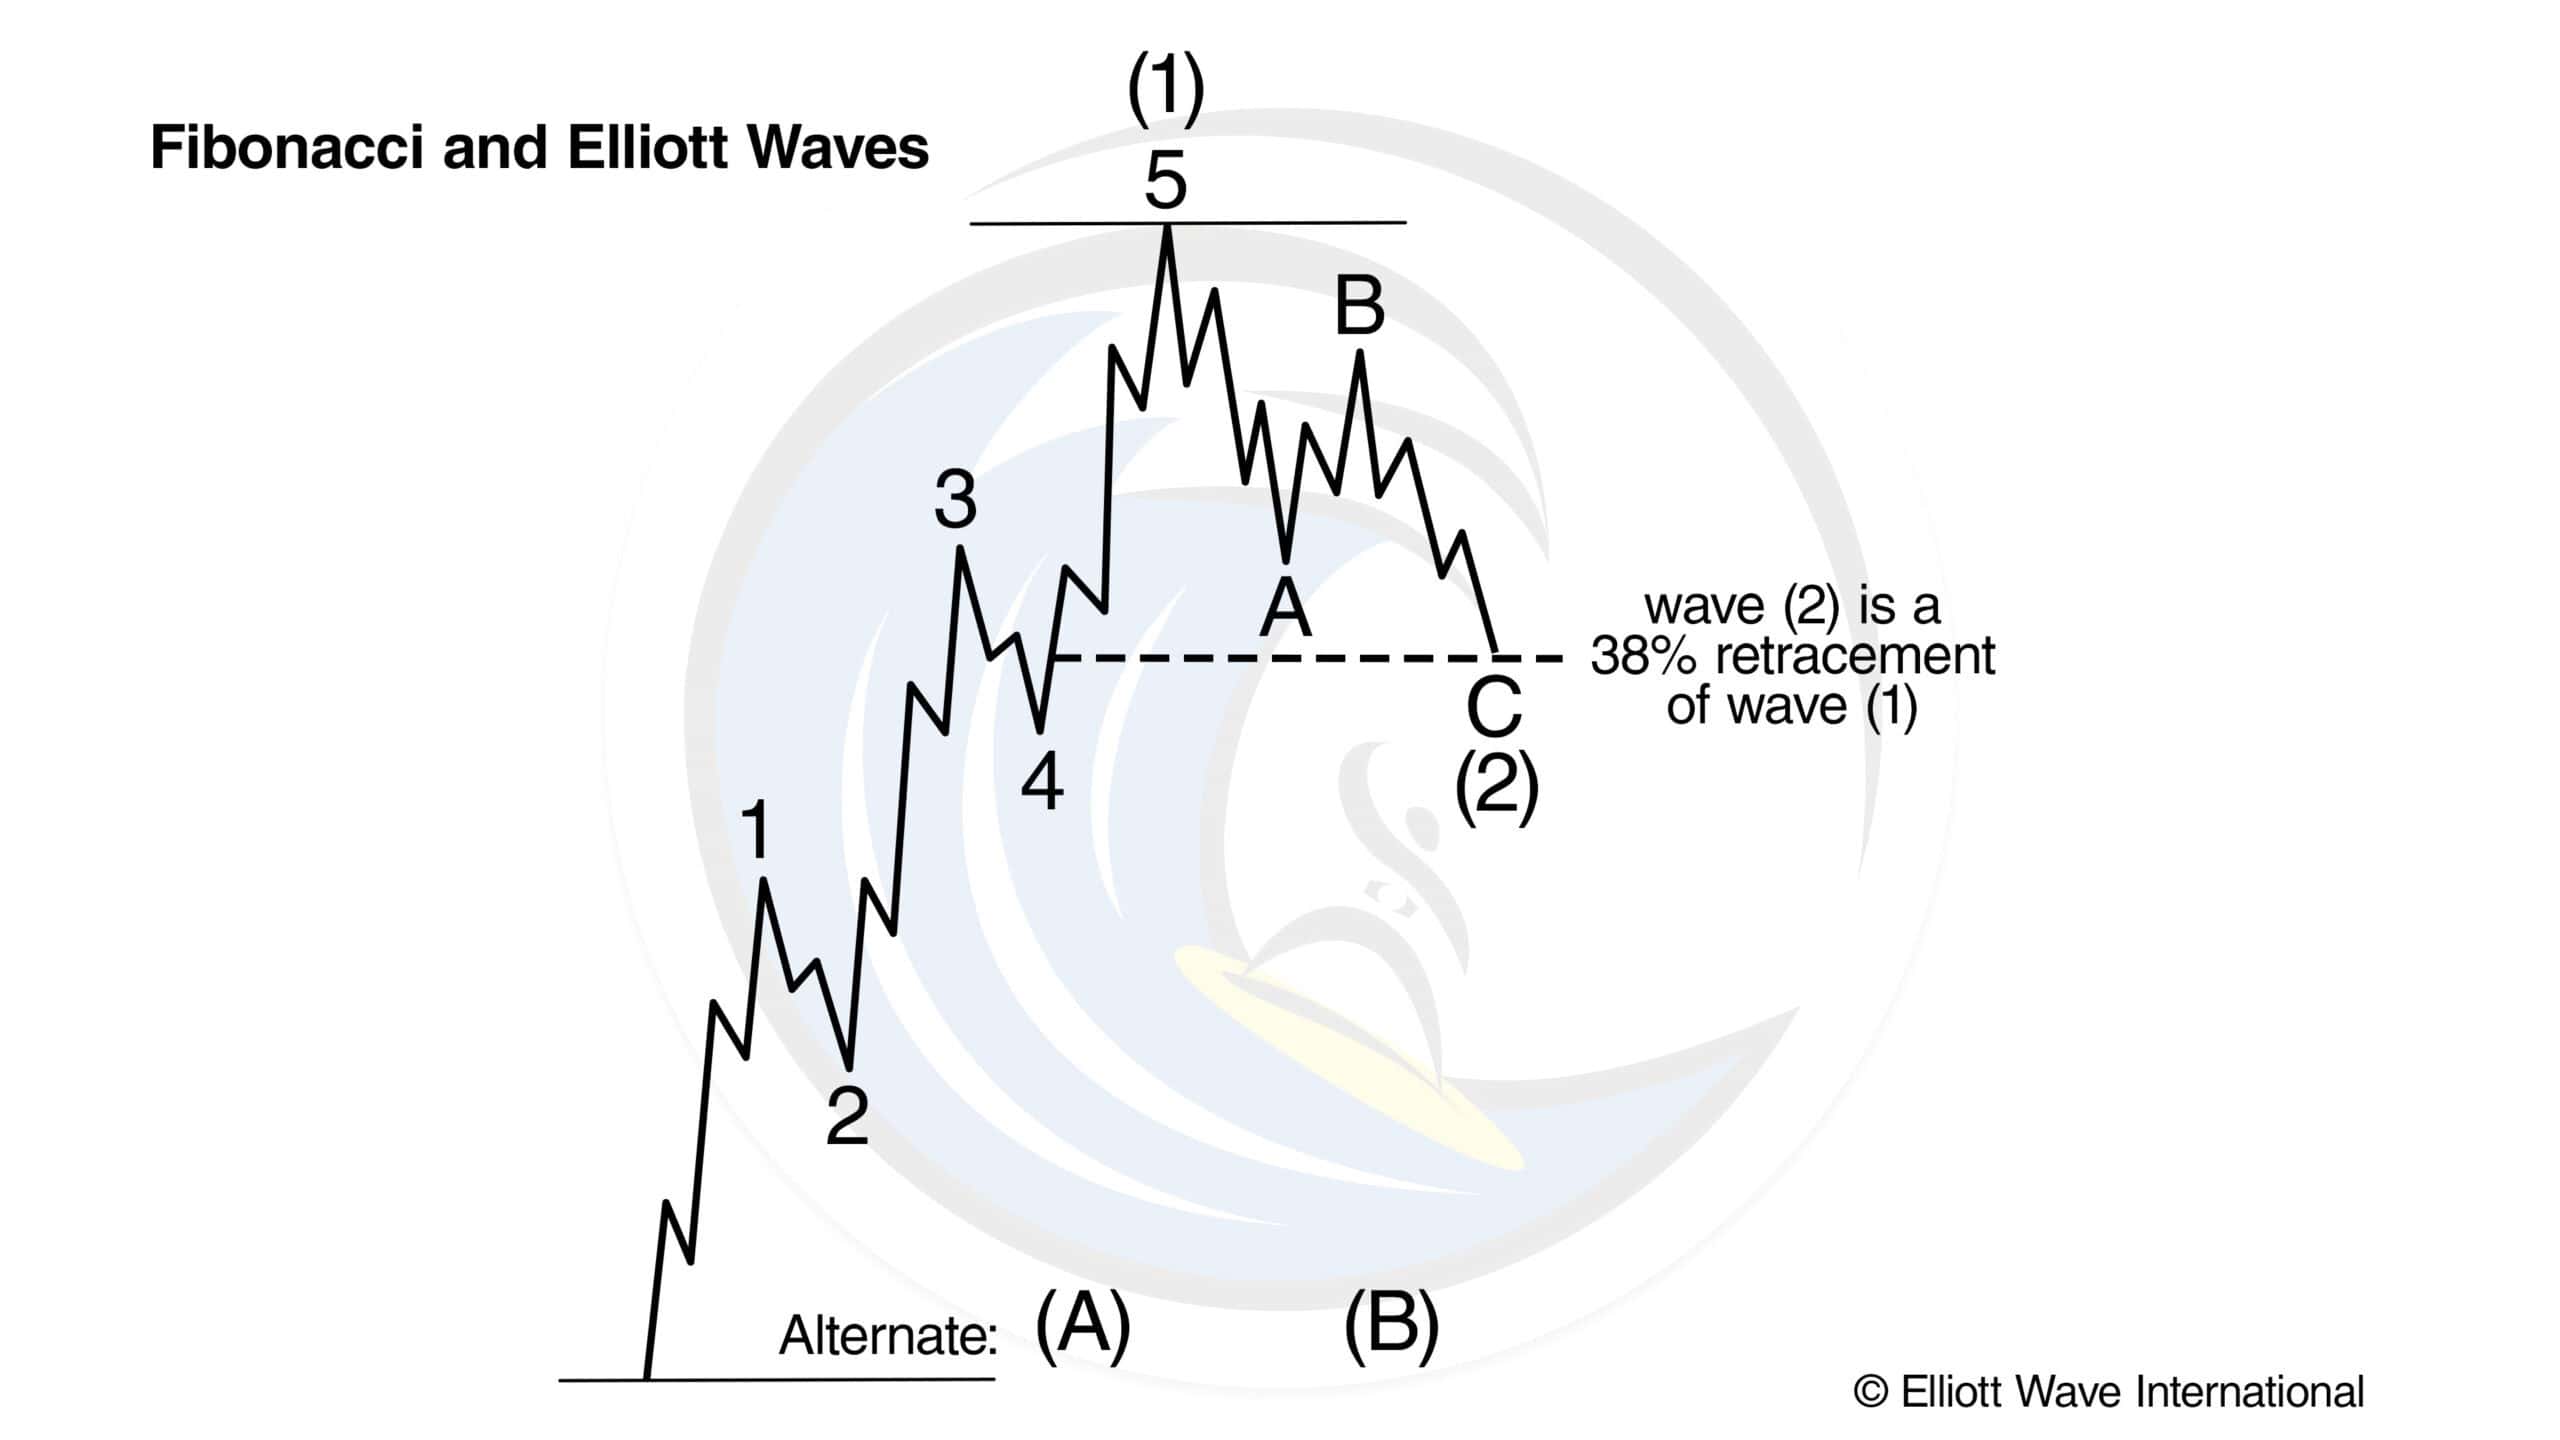
That’s a common relationship. Other frequent wave relationships are 50% and 62%.
Second, impulse waves of the same degree within a larger impulse sequence tend to be related to one another in Fibonacci proportion. (See Figure 2.)
“So wait… I can really learn to predict the markets?”
Yes. Markets aren’t rational. For every action, there isn’t always an equal and opposite reaction.
What drives prices isn’t logic, but emotion. Market emotions unfold in predictable patterns called Elliott waves. That’s what makes prices predictable.
What you just read is from the Wall Street bestseller, “Elliott Wave Principle: Key to Market Behavior.” For 40+ years, it’s been a top-shelf book on unbiased market analysis.
Amazon reviewers call it “classic and essential” and “the bible of the theory.” Now, you can get instant, FREE access to the full online version of this book ($29 value).