Elliott Wave International Master Theme.
-
Can Authorities Bolster Stocks (and Fend Off Recessions)?
Let’s address the widely held belief that financial authorities possess the wherewithal to boost the stock market – and even ward off recessions. This is a fallacy. This brief review of the 2007-2009 financial crisis is a case in point.
-
What “Fear Index” VIX May Be Signaling
Elliott Wave International uses dozens of market indicators to help subscribers stay ahead of the crowd. Some of these indicators provide the first hints of what may be just around the corner. Here’s a case in point.
-
ADM Dives 24%: Why “Bad News” Was NOT the Culprit
Archer-Daniels-Midland Company is a commodity giant. When its share price took a 24% tumble in a single day recently, the world noticed – and blamed it on some negative news about ADM. But watch our Global Market Perspective contributor Murray Gunn show you how ADM’s Elliott wave pattern called the dramatic drop well before the…
-
Insights into Jobs Reports and the Trend of the Stock Market
Many investors have been conditioned by the media to connect the day’s stock market action with news or events. It’s well past time to get “unconditioned.” Let’s start by busting a market myth which has been around for quite a while.
-

Traders Can Unlock Precious Metal Price Moves. They Just Need the Right Key.
In early March 2022, palladium traders were handed a silver “fundamental” BULLet – Russia, a major palladium producer, just declared war in Ukraine. And yet, palladium prices have plummeted 60% to 5-1/2-year lows since. Any questions? Well, we have all the answers.
-
Make Bitcoin’s Volatility Work for You
Emotional swings in financial markets – like bitcoin – usually trace out clear Elliott waves. Learn how we pinpointed a possible price low more than a year ago. This chart is revealing.
-
AAPL, MSFT, PODD, TMO: The Power of Trading with Elliott Waves
Every day, our 3 Flash services scan dozens of stocks, ETFs, futures and cash indexes. When a solid market setup occurs, subscribers get a Flash alert: a simple “buy/sell” recommendation supported by an Elliott wave-labeled chart. You also get follow-up “adjust stop” Flash alerts as we monitor the move.
-
Uranium Miner CCJ: What Helped Us Spot a Major Bottom
The boom in commodity prices and commodity stocks have made some investors – the prepared ones – very happy. Was there a way to foresee the bottom in commodities? Watch as Global Market Perspective contributor Mark Galasiewski walks you through a price chart of CCJ, uranium mining company Cameco, to explain the Elliott wave setup.
-
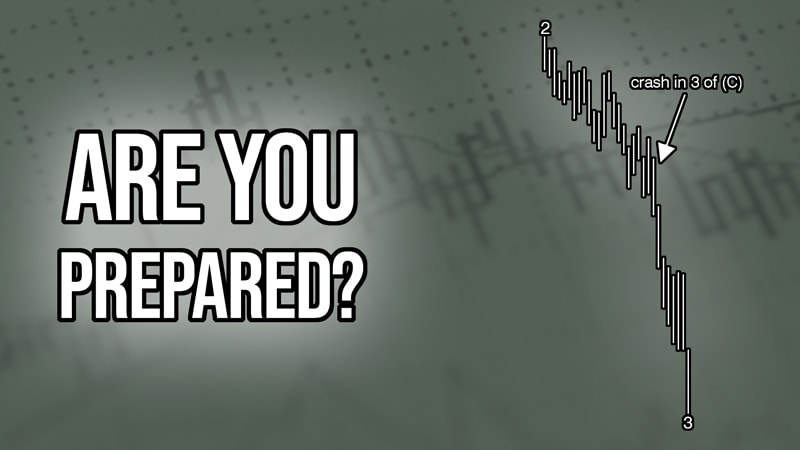
We’re Watching 30+ Potential Third Waves Right Now: Here’s Why
The third wave in a five-wave Elliott wave pattern is usually the most powerful wave. Review these two examples.
-
The Cycle of Optimism: 2 Years Up, 2 Years Down?
When you place a chart of the DJIA next to a chart of the “fear index” VIX, a steady two-year cycle of retail investor optimism emerges. It so happens that this optimism cycle is nearing another reversal point right now. Watch as Market Trek host Brian Whitmer explains the implications. (Brian’s global spot today is…
Got any book recommendations?