“Note the succession of higher closing lows relative to higher highs in …”
First, just a quick basic fact about the CBOE Volatility Index (VIX) – also known as the stock market’s “fear gauge”: the lower the reading, the higher the complacency among investors. Higher readings indicate increased investor nervousness.
With that in mind, let’s look at a revealing chart from our Jan. 24 U.S. Short Term Update. As the thrice weekly publication notes:
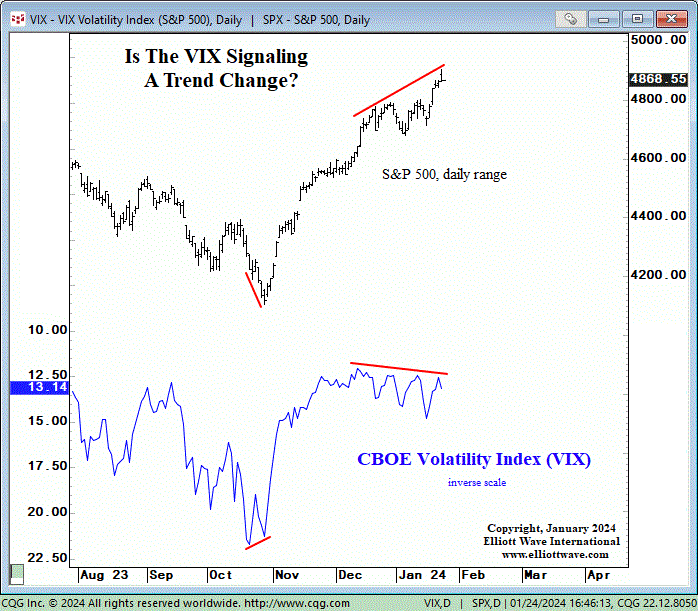
The bottom graph shows the CBOE Volatility Index (VIX), which we have inverted to align with the S&P index at the top. The VIX made a closing low of 12.07 on December 12. Since then, note the succession of higher closing lows relative to higher highs in the S&P 500. Is this subtle sign of a loss in investor optimism a signal that the market is about to change trend?
Only time will tell, of course, but some recent headlines are already reflecting the message of the chart (CNBC, Jan. 16):
[Financial TV show host] says the market is ready for a pullback
The well-known pundit goes on to say that he’s not a bear – just that some stocks which have risen parabolically may be due for a correction.
So, yes, some worry is beginning to creep into some financial articles about the stock market. Yet, make no mistake, optimism is still largely dominant – just not quite as dominant as it was during the first half of December.
As the Jan. 24 Elliott Wave Theorist Interim Bulletin notes:
The stock market continues to sport historically high valuations and elevated optimism, as recorded throughout dozens of sentiment and valuation indicators.
So, indeed, the VIX’s succession of higher closing lows is a “subtle” indicator – which by no means diminishes its value. By the time a stock market gauge becomes overwhelmingly obvious, well, damage to portfolios may have already occurred.
Here’s what you need to know: Elliott Wave International’s publications show dozens of market indicators which can put you ahead of the crowd.
Learn more by following the link below.
Keep Tabs on Measures of Investor Psychology: Here’s Why
Every month, our Elliott Wave Financial Forecast devotes a section to Investor Psychology for this important reason: It’s what drives financial markets – including the main stock indexes.
What you need to know: Investor psychology is patterned. The trends follow a recognizable path during each market cycle.
We identify high-confidence junctures along that path so you can anticipate likely market turns ahead.
As for the next major turn … please know it may be one for the history books.
Get insights now by following the link below.