Example: Palladium’s dramatic 60% selloff was foreseeable from an Elliott wave perspective
If ever there were a time for “fundamental” analysis to prove itself true, it was early March 2022. Russia, home to Nornickel, the world’s largest producer of palladium, declared war on Ukraine on February 24. This occurred at the same time as a record global supply deficit of palladium. Trading sanctions are enforced. Stock continues to be restrained. And uncertainty reigns supreme.
That conflict, according to mainstream experts, would be the spark to light palladium’s bullish keg, as these March 4 headlines recall:
- “Palladium hits 7-1/2-month peak as Russia-Ukraine conflict deepens” — Reuters
- “Palladium sprints to $3,000/oz mark as Russia supply fears grow” — CNBC
- “Palladium Eyes Record Prices As Russia Ukraine War Looks to Deepen Supply Deficit” — MarketWatch
From Business Day on March 7, 2022:
“Palladium was up 4.3% at $3,130.16 per ounce, after hitting an all-time high of $3,172.22 earlier in the session. Russia accounts for 40% of global production of the autocatalyst metal, used by automakers in catalytic converters to curb emissions.
“We’re looking at a very significant pickup in concerns around the disruptions with Ukraine seemingly because the conflict is showing signs of broadening,”
The Russia-Ukraine conflict did indeed broaden, and yet, the wind died out of palladium’s when the dust hadn’t even begun to settle (it still hasn’t settled nearly 2 years later) – and yet, platinum priced plunged.
The news was not driving this market’s trend.
Investor psychology, which unfolds as observable Elliott wave patterns directly on price charts, has been.
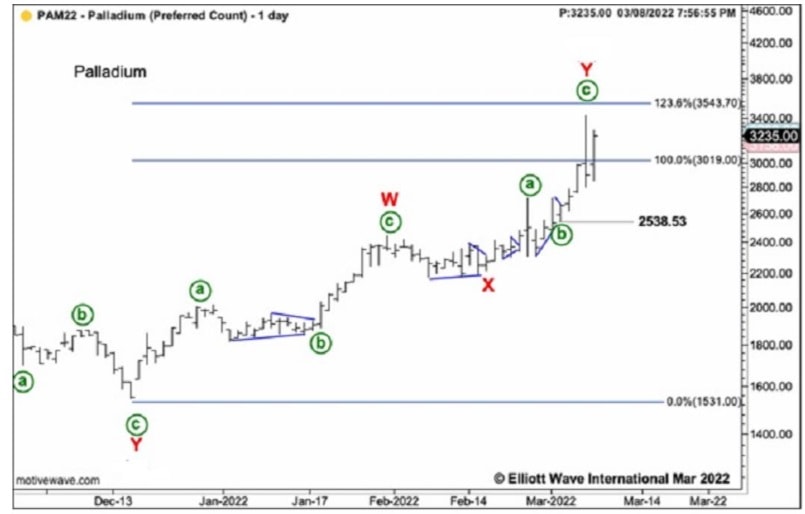
Here, we approach the 2022-present meltdown in palladium from the Elliott wave perspective. On March 8, 2022 our Metals Pro Service showed this chart of palladium. There, we identified a complete uptrend and prepared the bearish way forward:
“It seems like wave ((c)) of Y is over. Falling lower would open the door to considering either that price was topping… Broadly, I am viewing the rise of palladium as a double zigzag in its final wave up.“
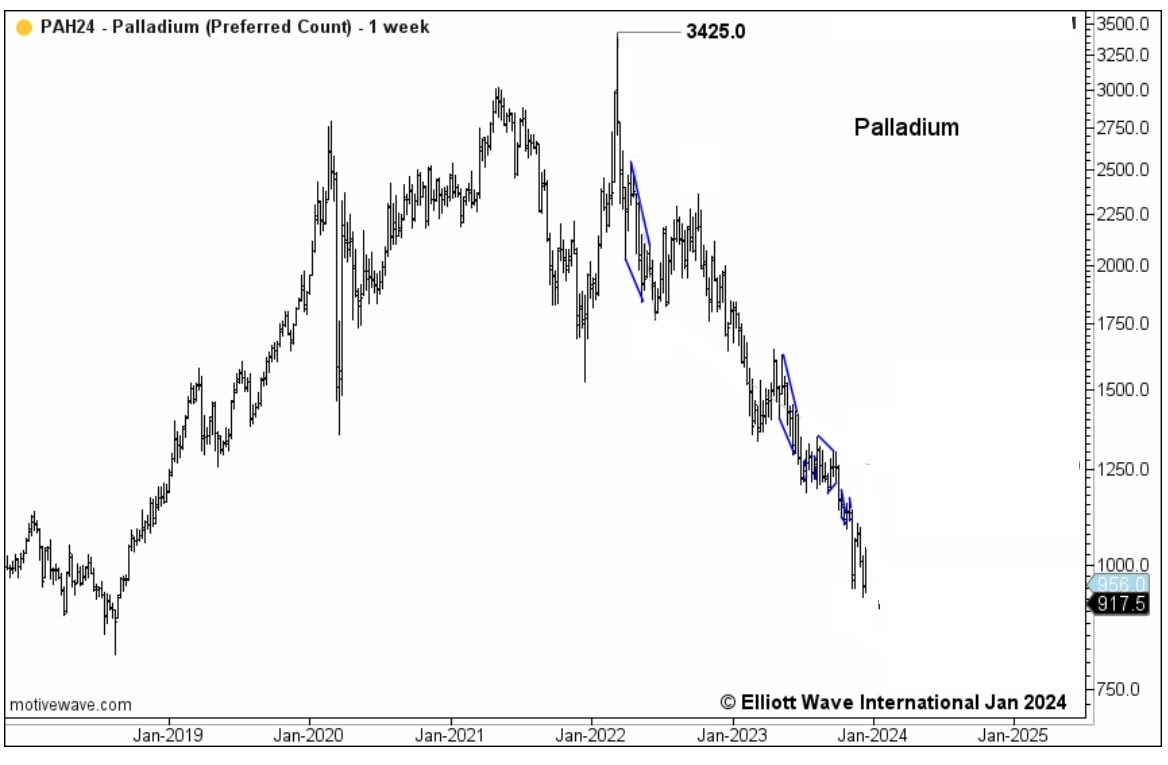
And, this next chart captures palladium’s bearish crash that followed – all the way into last December’s low:
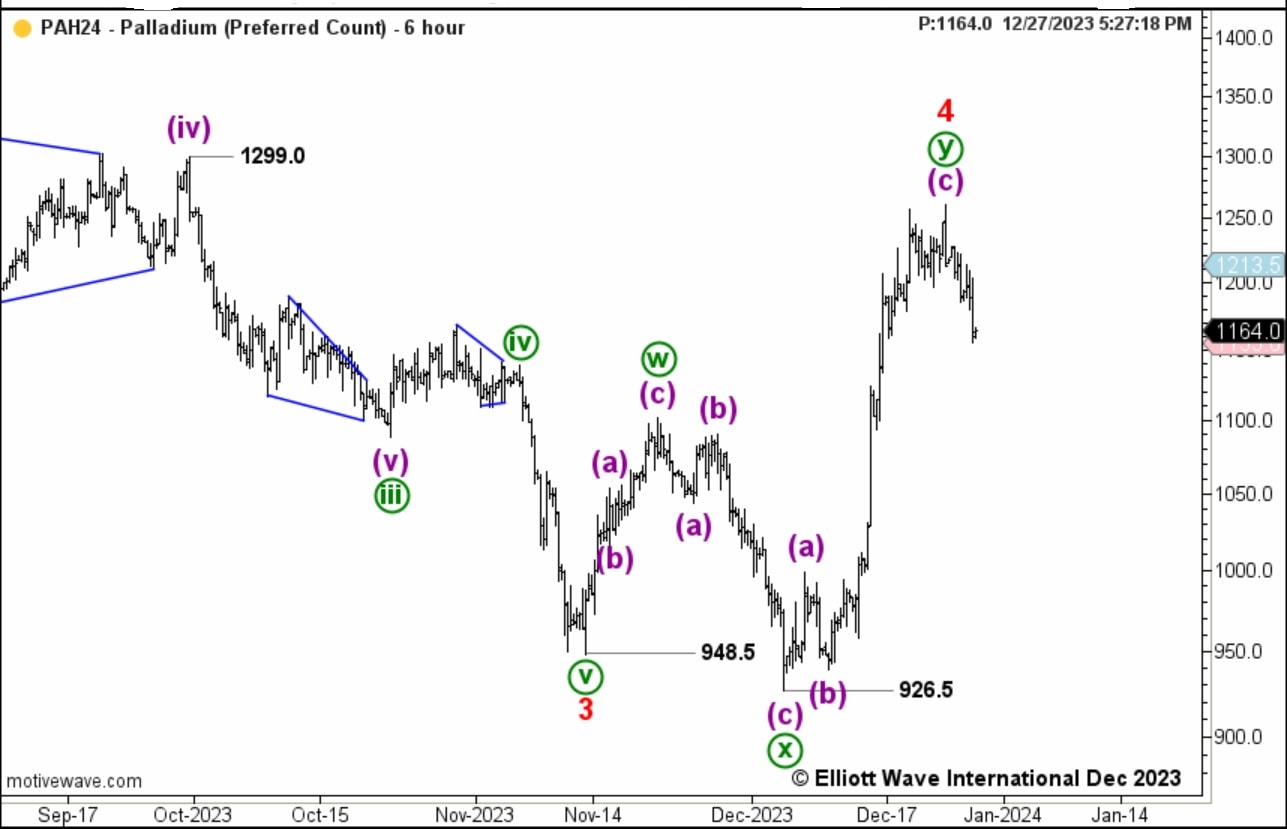
Here’s where we pick up the near-term baton. After a ceaseless drudging, last December palladium prices spiked. But, on December 26, our Metals Pro Service warned the rally was a fourth-wave bounce that would be swiftly retraced. From Metals Pro Service:
“Recent weakness raises the potential the double three-correction up is topping at 1260.00. Falling below 1101.50 would suggest wave 5 down to new lows was underway.”
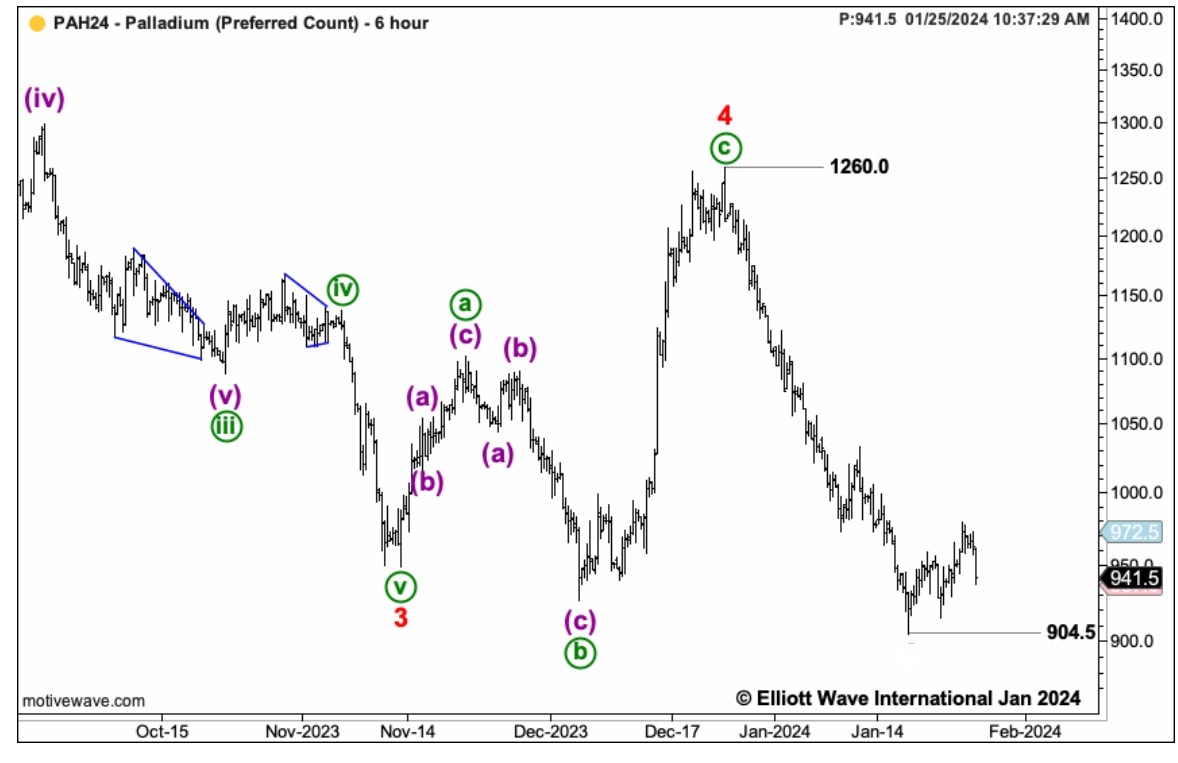
And this next chart shows palladium wasted no time in resuming its descent, this time to 5-and-1/2-year lows into January.
From above $3400 per ounce to near $900 per ounce, palladium’s ups and downs followed the Elliott wave path while mainstream analysts searched for clues within the “fundamental” backdrop.
But we consider a different guiding source: the Elliott wave patterns of collective investor psychology.
Golden Opportunities in Global Metals Markets
Right now, our Metals Pro Service takes you from passive observer to armored participant. This means, you’ll learn how to recognize specific price patterns that show the trend and a price target; or a correction that’s about to end; or the vital support and resistance levels for risk management.
Ready to see where the next opportunity could be in not only palladium, but also gold, silver, platinum, copper and more?
Then look below for the quick, instant-access steps to add our premier Metals Pro Service to your trading toolkit.