U.S. Market Coverage
Flagship Services
Elliott Wave Theorist – Elliott Wave Financial Forecast – Short Term Update
Our three flagship services offer a perspective on financial markets that is uniquely our own. Let others waste time arguing about the meaning of the latest news. We focus on market history, investor psychology, chart patterns and internal market statistics. When conditions in a market become extreme, we stand boldly against the consensus. We do that at all degrees of trend, from daily fluctuations to waves lasting centuries.
With two monthly publications and market updates delivered three times a week, you’ll stay on top of U.S. stocks, bonds, gold, silver, the U.S. Dollar and more.
We’re smart. We think you are, too. If you can keep up with us, you’ll have fun.
Stop reacting to the news. Start anticipating the market.
Our flagship services focus on what actually moves markets: investor psychology and Elliott wave structure — not headlines — so you can anticipate major turning points before they unfold. For more than 45 years, these publications have identified many bullish and bearish opportunities for their subscribers.
For example: Calling The Great Recession & Its Bottom in Real-Time
In July 2007, as stocks were still climbing and risks were widely dismissed, The Elliott Wave Theorist warned:

July 17, 2007:
“Aggressive speculators should return to a fully leveraged short position now. We may be early by a couple of weeks, but the market has traced out the minimum expected rise, and that’s enough to act upon.”
Then in August and September, The Elliott Wave Financial Forecast told subscribers:
August 1, 2007:
“The transition from the Great Asset Mania to the Great Credit Contraction is confirmed by a turn down in the major stock indexes, which started “the great decline” following one more new high in July, as forecast here last month. Sentiment continues to view the credit bust as specific to the subprime area, but it should be global in scope. Near term, a relief rally may well be starting, but it should hold well beneath the July highs and lead to greater selling pressure.”
September 28, 2007:
“The July 17 Interim Report of The Elliott Wave Theorist identified the DJIA’s top tick to the day and advised a return to a fully bearish stance… the entire rally from 2002–2003 should be complete and bear market back underway.”
After a slight new high in the Dow in October (but not in the NYSE or DJ Composite indexes), the U.S. entered the worst financial crisis since the Great Depression.
Then, in early 2009 — when fear dominated and most expected further collapse — we said this to subscribers:
The Elliott Wave Theorist,
February 23, 2009:
“…over the past four months EWT, EWFF and STU have repeatedly stated, without equivocation, that the market required a fifth wave down. There were no alternate counts. The Wave Principle virtually guaranteed lower lows, and now we have them.
If you are a slick trader, perhaps you can finesse the final waves or snag some more profits early tomorrow. But as for our official position, I recommend covering our short position at today’s close.
The Elliott Wave Financial Forecast,
February 27, 2009:
“Some measures of market sentiment are achieving pessimistic extremes, so the decline is likely reaching its latter stages…
Once five waves are complete within wave (5), the odds will be high that a low is at hand.”
Just days after our reports, the market bottomed on March 9, 2009 — launching one of the most powerful bull markets in history.
Our subscribers weren’t reacting to extremes — they were prepared for them.
Here’s the timing of those forecasts in the S&P 500:
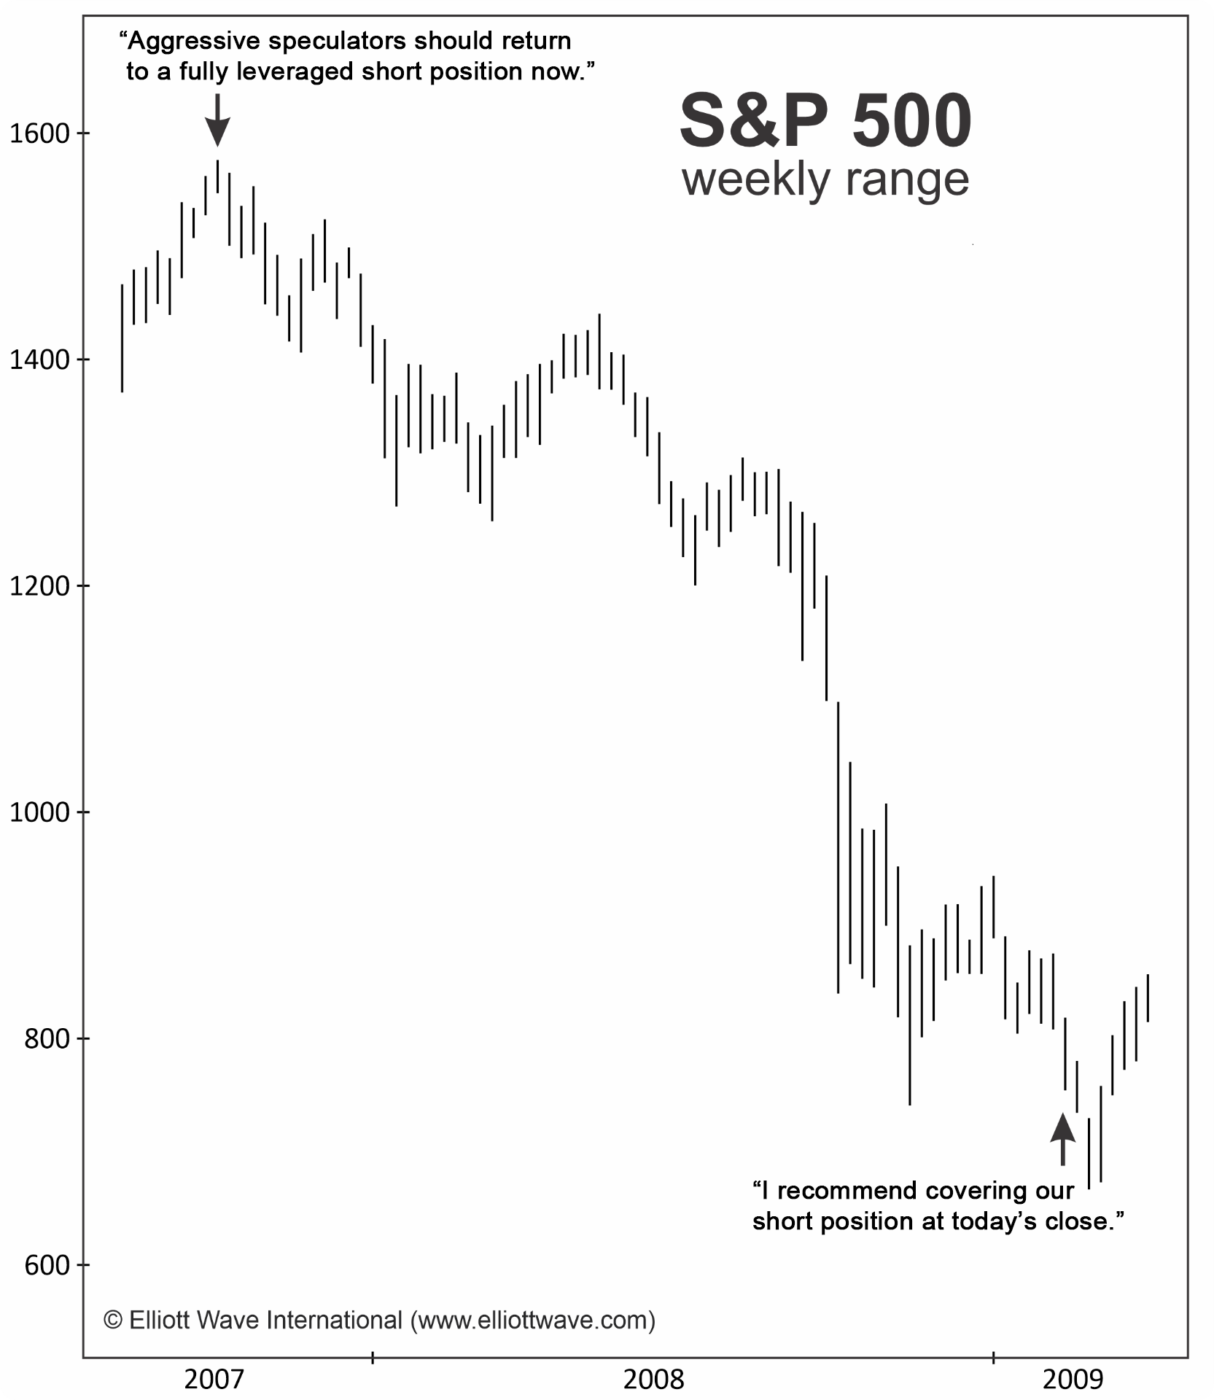
An 800-point trade speaks for itself… And now we may be on the precipice of another opportunity.
See What Our Analysts Are Saying Now:
“I’m a subscriber to all of your flagship publications and I find your analysis of the U.S. stock markets, bonds, the dollar and precious metals to be of the highest caliber. You have achieved a level of expertise which is unparalleled in the industry, and your analysis definitely needs to be an integral part of any serious trader’s decision making process.”
– Chester B.
About Our 3 Flagship Services
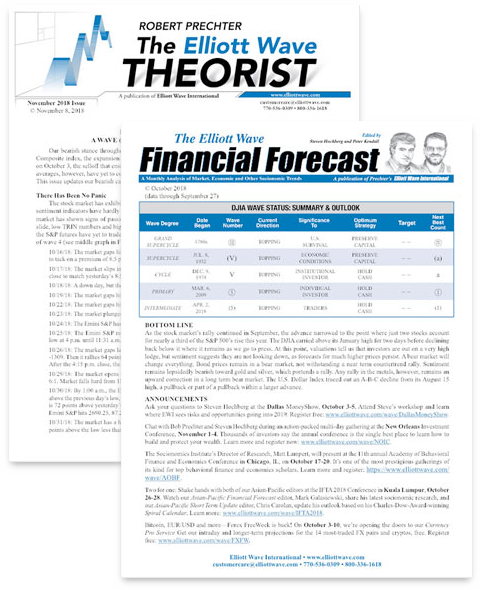
 The Elliott Wave Theorist monthly publication
Published continuously since 1979 by Elliott Wave International’s founder and president Robert Prechter, the monthly Elliott Wave Theorist provides macro perspectives on the markets and society.
Each issue focuses on what subscribers most need to understand right now.
 The Elliott Wave Financial Forecast monthly publication
Co-written by Steven Hochberg & Peter Kendall, the monthly Elliott Wave Financial Forecast provides a longer-term view of U.S. stock indexes, bonds, gold & silver, the U.S. dollar, inflation vs. deflation, macroeconomic trends, and even cultural indicators such as the popularity of movie genres, pop stars and U.S. presidents. How cool is that?
Why two monthly publications? To keep you continually informed. TheTheorist and the Forecast leapfrog each other throughout the year. The Forecast comes out at the start of each month, and the Theorist comes out mid-month.
 Short Term Update market updates 3x a week
If you’re active in the markets, the Short Term Update is a natural fit. Editor Steven Hochberg calls it a “bridge between the monthly issues.”
Every Monday, Wednesday and Friday, the Update delivers concise analysis and updated Elliott wave charts on where stocks, bonds, gold & silver and the U.S. dollar may be headed in the next few trading sessions—while flagging any important shifts in outlook along the way. Are we on track? Have we hit our targets? Do we need to change course? Is there new information that matters?
Subscribers rely on the Update. You will too.
Who’s a part of the Flagship Services Analytical Team?

Robert Prechter Founder and President, Elliott Wave International
Robert Prechter’s name is familiar to market observers the world over. Prechter has shared his market insights in The Elliott Wave Theorist since founding Elliott Wave International in 1979. Prechter developed a theory of social causality called socionomics, whose main hypothesis is that endogenously regulated waves of social mood prompt social actions. In brief, events don’t shape mood; mood shapes events. Prechter has co-authored several academic papers and written 20 books on finance and socionomics, including a New York Times bestseller. You can find a full bio at www.robertprechter.com.

Steven Hochberg Chief Market Analyst
Steven Hochberg co-writes our monthly Elliott Wave Financial Forecast and issues our Monday-Wednesday-Friday Short Term Update. As a foremost expert in Elliott wave forecasting, Steven is a sought-after speaker at investment conferences. He has been interviewed by Barron’s, Bloomberg, CNBC, MSNBC, The Los Angeles Times, The Washington Post and other media outlets. Steven began his career at Merrill Lynch and joined EWI in 1994.

Peter Kendall Chief Analyst for U.S. Markets and Cultural Trends
Peter Kendall places financial markets within the larger context of trends in social mood. From the heights of skyscrapers, roller coasters and hemlines to the depths of politics, pop music and divorce rates, Peter shows how these elements elucidate waves of social mood, which in turn coincide with financial trends. Peter co-edits our monthly Elliott Wave Financial Forecast and on occasion contributes to the Short Term Update. Peter began his career writing for the OTC Stock Journal and joined Elliott Wave International in 1992.
I’ve heard enough. I’m ready to try it.
What’s your track record? EWI is a publisher — not an investment advisor. What subscribers choose to do with the information we provide is entirely up to them. But for more than 45 years, our analysts have identified major market peaks and bottoms, often when the crowd believed the opposite.
Read our Stock Market Highlights report to see direct excerpts from our publications — real-time forecasts that helped subscribers prepare for some of the biggest market moves before they happened.
What do I get with a subscription? Immediate access to the latest issues, so you can get up to speed quickly. From there, you’ll be notified whenever a new issue or update is published.
You also get access to “Subscriber Extras” and free educational materials including: books, reports, videos and free or discounted trials of our other services that you may find valuable.
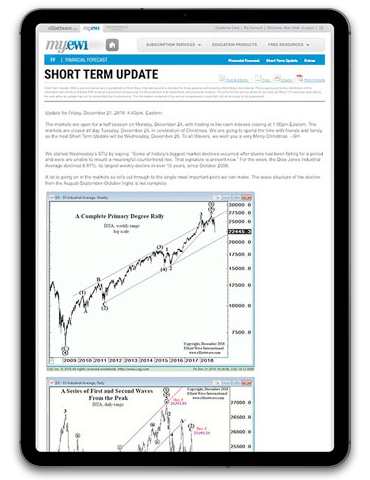
How is it delivered? All publications and resources are delivered online through our MyEWI Subscriber Portal. Just sign-in through your computer, phone or tablet for instant access. Here are some photos of what it looks like:
The MyEWI Home Dashboard – To Access All Your Subscriptions & Resources
The Financial Forecast Subscription Portal

The Elliott Wave Theorist Subscription Portal
All issues of your subscription can be viewed instantly online via computer, phone and/or tablet.
You can also download and print your issues, if you would like to read them that way.
All subscriptions come with Free Educational Materials & Resources

“Subscriber Extras” vary depending on your subscription and update regularly.
I’m on the fence. Say something to help me decide. We could tell you how powerful these insights are—but we’d rather let subscribers, colleagues, and industry peers do the talking. Here’s what some of them have said about the work of Robert Prechter, Steven Hochberg, and Peter Kendall over the years:
Select Your Flagship Service Subscription Now:
Most Popular – Get Them ALL
Includes: The Elliott Wave Theorist, The Elliott Wave Financial Forecast, and Short Term Update
(Two monthly publications and market updates 3x a week — every Monday, Wednesday and Friday.)
Choose your billing frequency:
Monthly
$141/mo $97/mo
Annual
$1,692/yr $1,164/yr
(You Save 31%)
Get The Monthly Combo Package
Includes: The Elliott Wave Theorist & The Elliott Wave Financial Forecast
(Two essential monthly publications that leapfrog each other throughout the year.)
Choose your billing frequency:
Monthly
$74/mo $57/mo
Annual
$888/yr $684/yr
(You save 23%)
OR: Get Them Individually
Not ready to subscribe? Try a single issue >>
Order by Phone
Mon-Fri, 8am-5pm Et
Contact us at 800-336-1618 or 770-536-0309 (Internationally) and you will get a fast, friendly, knowledgeable person to assist you.
LIVE CHAT
Mon-Fri, 8am-5pm ET
Please use the LIVE CHAT button at the bottom right of your screen to chat with us.
We accept online payments from Visa, MasterCard, American Express, Discover, and Bitcoin through our online store. We also accept payment via PayPal, money order, bank wire, and check (drawn off a U.S. bank). If you would like to pay by any of these methods, please contact our Customer Care Representatives via phone, email, or live chat to place your order.
Stock Market Highlights
A Record of Historic Stock Market Calls From Our Flagship Services
For over 40 years, our analysts have called historic peaks and bottoms in the stock market — often when the crowd was most convinced of the opposite.
Here are the direct excerpts from our publications — real-time forecasts that helped subscribers prepare for the biggest moves before they happened:
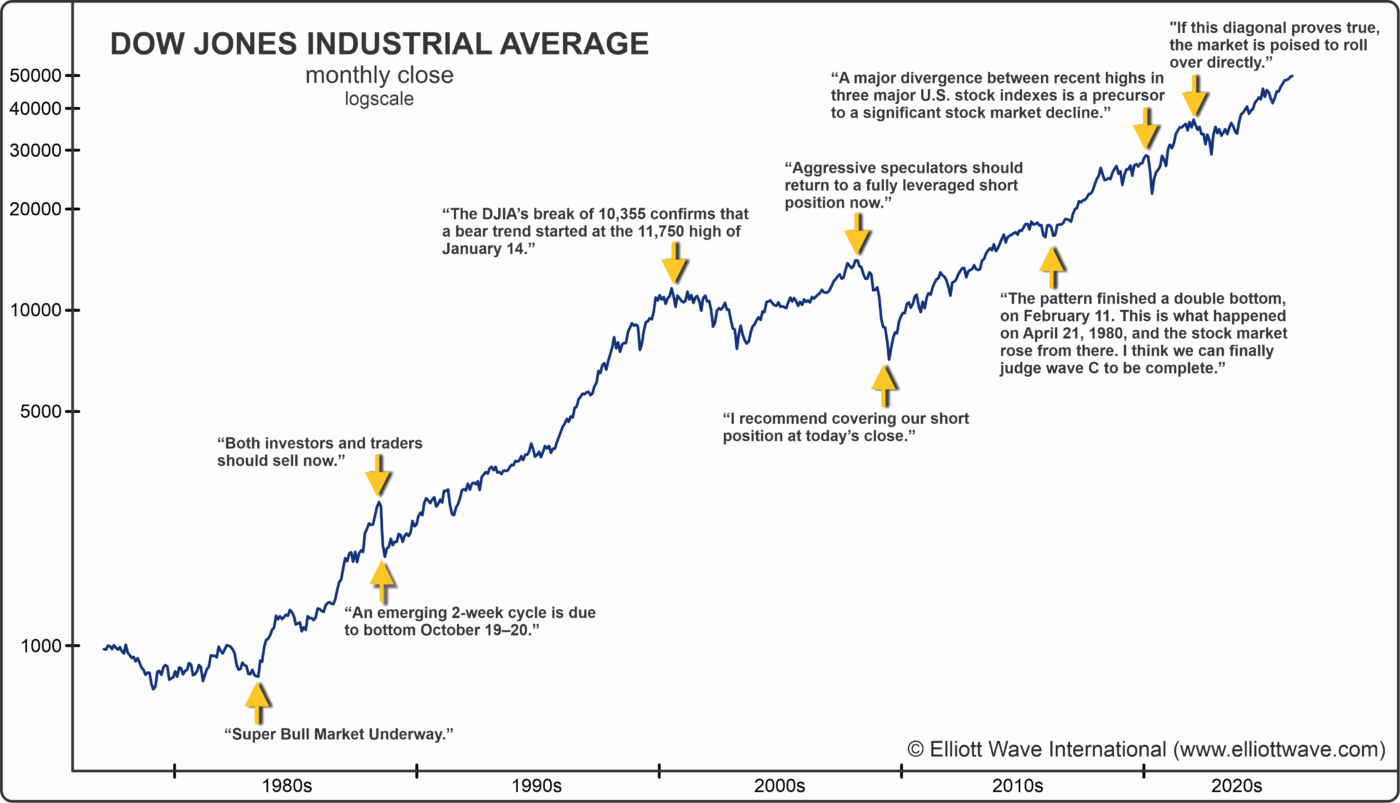
1982: “Super Bull Market Underway”
By mid-1982, the stock market had suffered through more than a decade of stagnation. Inflation was still elevated, interest rates were historically high, recession fears were widespread, and investor sentiment was deeply pessimistic. Almost no one was looking for — or even willing to consider — the start of a major new bull market. Here is what we said:
Analysis/Forecast:
September 13, 1982:
“The orthodox low for the wave count occurred on August 12 at 776.92 on a fifth wave failure, a rare and bullish occurrence.”
“No bear market rally I know of has had such good advance-decline figures.”
“Some incredibly large wave patterns may have been completed, patterns which have important implications…”
“If the market has indeed changed from ‘neutral’ to ‘up,’ then we have entered the first ‘buy and hold’ market since 1949.”
October 6, 1982:
“Super Bull Market Underway”
“October 6, 1982 will go down as a very important date in stock market history. The action on that date confirmed the beginning of a new bull market for Dow Industrial stocks on August 12.”
“The whole orientation of strategy will now have to change from one of aggressively trading the intermediate swings to purposefully accumulating stocks for a long upward pull.”
“Do not assume it is ‘too late’ to get invested for the long term.”
“The market may have 200 points behind it already, but it’s got a long way to go.”
What Happened Next?
The call — made in real time, amid widespread pessimism — marked the transition into the most powerful bull market in U.S. history.
1987: Black Monday — The Warning Before the Crash, and the Bottom Window Identified in Advance
In early October 1987, sentiment was exuberant. Many publications were suddenly predicting “Dow 3000 by year end,” while the market sat just below record highs. Yet beneath the optimism, internal conditions were weakening: breadth was narrowing, momentum was slowing, and the rally from late September was losing force. Almost no one believed a major decline was possible. Here is what we said:
October 5, 1987:
“The stock market is at a crossroads on a short term basis.”
“The case that Primary wave 4 will trace out a drop back to the 2300s remains valid.”
“The upside rate of change… has indicated a slowing of the advance… This is usually a bearish combination.”
“Both investors and traders should sell now.”
Interim Report – October 15, 1987:
“An emerging 2-week cycle is due to bottom October 19–20.”
What Happened Next?
The famous Crash of ’87 unfolded just days later. On Monday, October 19 — Black Monday — the Dow Jones Industrial Average plunged 22.6% in a single session, still the largest one-day percentage decline in its history. The market then bottomed the very next day, Tuesday, October 20 — exactly within the October 19–20 window our Interim Report had identified as “due to bottom.”
2000: The “Dot-Com” Peak
At the height of the technology mania, analysts declared a “new economy.” The Nasdaq’s parabolic surge convinced investors that the boom could not end. Here is what we said:

February 22, 2000:
“The DJIA’s break of 10,355 confirms that a bear trend started at the 11,750 high of January 14… A third wave is underway… Support is 9375–9575… A significant slice through this lower support increases the odds for a crash.”
“The NASDAQ 100… has been wedging higher since the beginning of the year. Prices have been tracing out an ending pattern called a diagonal … Once an ending diagonal finishes, prices usually decline sharply.”
Interim Report – March 1, 2000
“The Dow averages, S&P 500 and New York Composite are now in sync to the downside. The NASDAQ 100 achieved the new high allowed for in our Interim Report but now sits on the cusp of a sharp reversal as the pattern traces out the final subdivisions of its fifth wave. A close beneath 4024 will align this last rising index with the rest of the market and signal the end of the mania.”
What Happened Next?
The Nasdaq topped on March 10, 2000 — within weeks of our warning — and lost 78% over the next 31 months. The S&P 500 and Dow entered a multi-year bear market as the “new paradigm” collapsed.
2007: The Great Financial Crisis
Mainstream economists and policymakers dismissed subprime lending as contained. Markets hit record highs as credit risk ballooned. Here is what we said:
Interim Report – July 17, 2007:
“Aggressive speculators should return to a fully leveraged short position now. We may be early by a couple of weeks, but the market has traced out the minimum expected rise, and that’s enough to act upon.”
August 1, 2007:
“The transition from the Great Asset Mania to the Great Credit Contraction is confirmed by a turn down in the major stock indexes, which started “the great decline” following one more new high in July, as forecast here last month. Sentiment continues to view the credit bust as specific to the subprime area, but it should be global in scope. Near term, a relief rally may well be starting, but it should hold well beneath the July highs and lead to greater selling pressure.”
September 28, 2007:
“The July 17 Interim Report of The Elliott Wave Theorist identified the DJIA’s top tick to the day and advised a return to a fully bearish stance… the entire rally from 2002–2003 should be complete and bear market back underway.”
What happened next:
After a slight new high in the Dow in October (but not in the NYSE or DJ Composite indexes), the U.S. entered the worst financial crisis since the Great Depression.
2009: Calling the Bottom of the Great Recession
In early 2009, fear dominated. Most investors expected another collapse. Sentiment readings hit multi-decade lows. Here is what we said:
Interim Report – February 23, 2009:
“…over the past four months The Elliott Wave Theorist, The Elliott Wave Financial Forecast and the Short Term Update have repeatedly stated, without equivocation, that the market required a fifth wave down. There were no alternate counts. The Wave Principle virtually guaranteed lower lows, and now we have them.“
“If you are a slick trader, perhaps you can finesse the final waves or snag some more profits early tomorrow. But as for our official position, I recommend covering our short position at today’s close.“
March 1, 2009:
“Some measures of market sentiment are achieving pessimistic extremes, so the decline is likely reaching its latter stages… Once five waves are complete within wave (5), the odds will be high that a low is at hand.”
What happened next:
The S&P 500 bottomed on March 9, 2009 — just days after our reports.
2016: Calling the Next Advance
Stocks were sliding hard into early 2016. The Dow was retesting its August 2015 lows, volatility was elevated, and pessimism had reached levels last seen near the 2009 bottom. Many believed a historic crash was already underway. Here is what we said:
January 14, 2016:
“In the September 18, 2015 issue, EWT observed that the bear phase that began in May 2015 and accelerated in August was either the start of the biggest crash ever or part of a high-level correction that would lead to a new high…”
“The pattern so far has all the elements of a developing contracting triangle.”
“This decrease in internal intensity during an increase in external (price) movement is more compatible with wave C of a triangle than with a developing crash.”
“The critical area for wave C is about 16,000 on the Dow… Today’s low is 16,075.12.”
February 19, 2016:
“WAVE C OF TRIANGLE DONE”
“In line with the usual persistence of C waves, the pattern continued developing, finally finishing a double bottom last week, on February 11. On that day, the Dow registered a new daily closing low for 2016 but not a new intraday low.
“This is what happened on April 21, 1980 with respect to the preceding low of March 27, and the stock market rose from there. I think we can finally judge wave C… to be complete.”
“For the wave (4) labeling to remain viable, the Dow must hold above the low of February 11.”
What Happened Next?
The Dow held above its February 11, 2016 low. Wave (5) followed — carrying the Dow more than 20,000 points higher over the next five-plus years.
2020: The Fastest Bear Market in History
By late 2019 and early 2020, optimism toward stocks had reached euphoric extremes. Major indexes pushed to record highs as headlines declared the bull market “unstoppable,” fueled by Fed rate cuts and trade-deal hopes. Retail speculation surged to manic levels, daily trading hit records, and Gallup’s “Mood of the Nation” showed personal satisfaction at a 40-year high while concern about the economy fell to its lowest level in decades — classic signs of sentiment near a historic extreme.
October 2019:
“A major divergence between recent highs in three major U.S. stock indexes — the Dow Industrials, the S&P 500 and the NASDAQ Composite — as well as various laggards such as the Dow Jones Transportation Average and the S&P Small Cap 600 Index … is a precursor to a significant stock market decline.”
November 2019:
“A record net-short position in futures contracts by Large Speculators on the CBOE Volatility Index (VIX) suggests that an upcoming spike in volatility will wipe away the calm veneer.”
February 7, 2020:
“The Great Bull Market has become so entrenched that pundits use words such as raging and relentless to describe it (CNBC, January 18). One pundit projected a January rise and then an accompanying rally through the remainder of the year based on historical precedent. With a late January swoon, however, the Dow Jones Industrial Average began the year with a down month. It is a small hint at what we view as strong potential for a bearish surprise in 2020.”

February 21, 2020
“The S&P 500 appears to have completed wave 5 at 3393.52, the high on February 19. The decline to 3328.60, a low this afternoon, may be labeled as five waves. This impulse pattern is wave i of a larger five-wave declining structure. Wave ii will be a snapback rally that will likely last 1-3 days. When complete, the index will start wave iii down. … The other option is that a series of first and second waves have developed since the high, which implies acceleration of the declining trend next week. The recent highs on February 12-19 (Dow and S&P) are now a key level for the bearish case.”
February 24, 2020:
“Various news stories in print and on TV proffered myriad explanations for today’s selloff — Coronavirus, outbreaks in Italy, China’s economic slowdown, outbreaks in South Korea, weak potential for companies doing business in Asia, etc. — but none stand up to reality. All these supposed causes have been well known prior to today. The reason the market accelerated its decline is because it was at the point in the progression of its Elliott wave pattern that indicated a sharp drop.”
What Happened Next?
The Dow peaked February 12 at 29,568 and the S&P 500 followed February 19 at 3393.
In only seven trading days, the S&P fell 16 percent — the fastest drop from an all-time high in history — and in five weeks, major indexes were down more than 35 percent.
January 2022: Warning of a Trend Change
In late 2021, U.S. stocks were still in strong uptrends and making fresh highs. Investor confidence was elevated, volatility was subdued, and most commentary assumed the bull market would continue uninterrupted into 2022. Here is what we said:
Interim Report – December 31, 2021:
“The December 23 Interim Bulletin postulated an expanding diagonal in progress for wave 5. It stated:
“This labeling calls for the Dow to pop to one more moderate new high in coming days, probably to a peak below the upper line, and then turn down…”
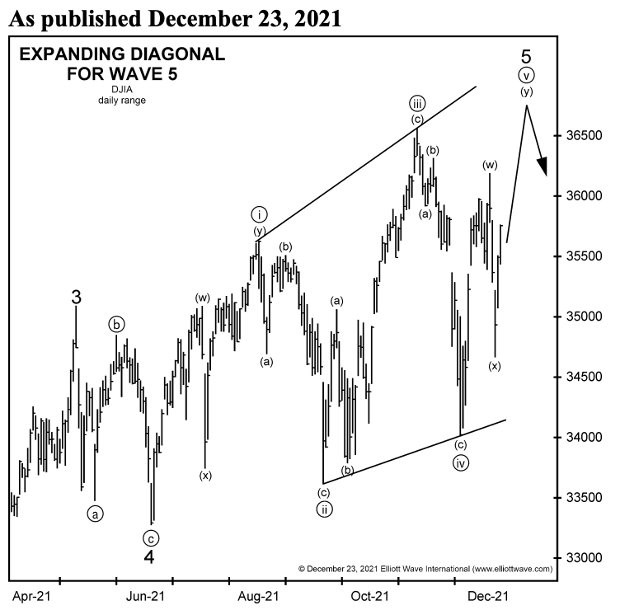
“Diagonals occur at the end of larger sequences. If this diagonal proves true, the market is poised to roll over directly into a bear market.”

January 5, 2022:
“Blue chip indexes appear to have topped in the first three trading days of January 2022. The S&P Composite made a closing high on the first trading day of the year, January 3, and an intraday high on January 4.
The Dow Jones Industrial Average and the NYSE Composite index each made a daily closing high on January 4 and an intraday high on January 5.
The last index to peak was the DJIA, at 12:32 p.m. today, 3.5 trading hours ago.”
What Happened Next?
After January 5, 2022, the Dow declined 22% to its October 2022 low. The S&P 500 fell 25%, and the Nasdaq Composite dropped 36%, marking the 2022 bear market.
Other Market Highlights
Our Flagship Services go far beyond the major U.S. stock indexes.
Here are just a few highlights from other markets they’ve covered over the years:
2008- Collapse in Crude Oil
By mid-2008, crude oil had become the world’s hottest trade. Prices had risen seven-fold in six years amid “peak oil” headlines, record speculative inflows, and near-unanimous belief that $200 per barrel was inevitable. Sentiment hit extremes — on July 2, 2008, just nine days before the top, the DSI showed 97% bulls among oil-futures traders. Here is what The Elliott Wave Theorist said to subscribers on June 8, 2008:
Analysis/Forecast:
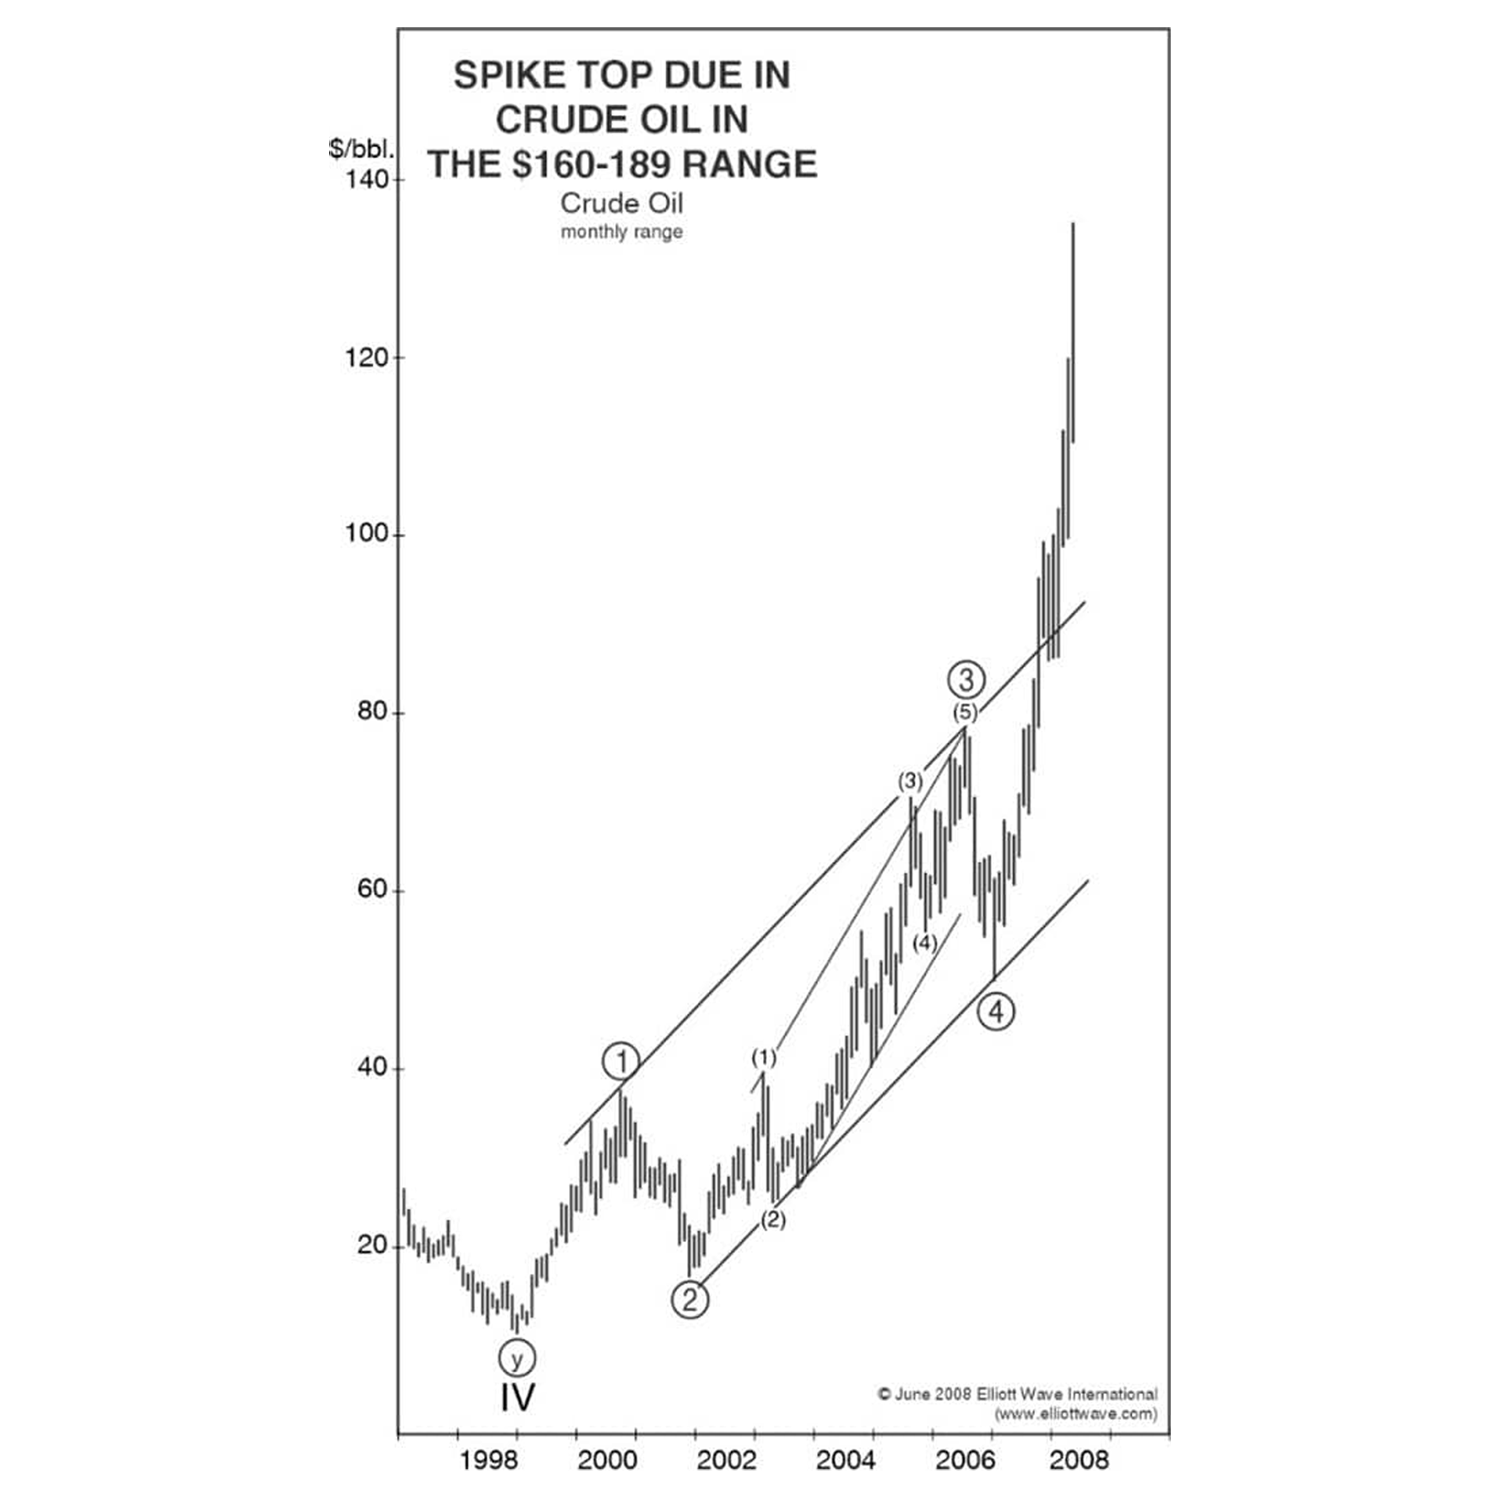
The Top of Wave 5 in Crude Oil Is Fast Approaching
“I am publishing this issue a bit early in order to alert you to an opportunity developing in the oil market. Bull markets in commodities virtually always end with an extended fifth wave, as explained in Chapter 6 of Elliott Wave Principle. So, one of the greatest commodity tops of all time is due very soon. Ideally, crude oil should end on a violent spike high in the $160-$189 range.
What Happened Next?
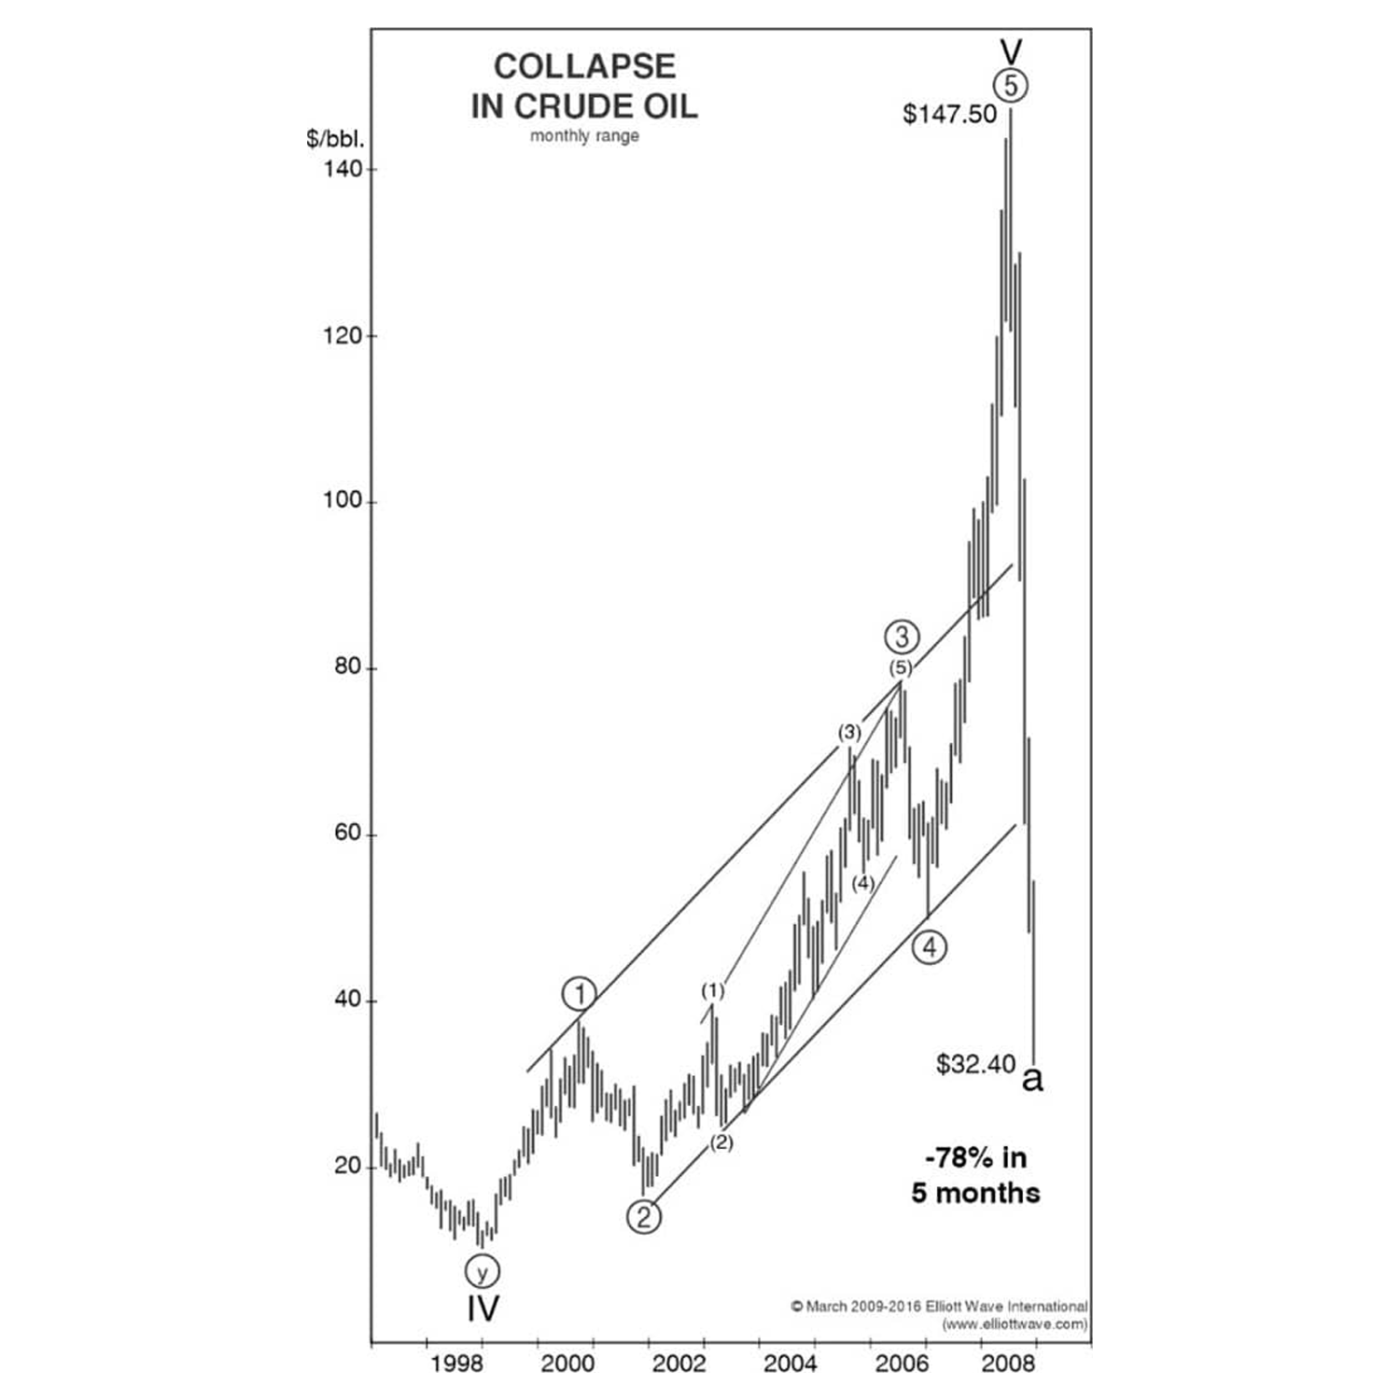
And just one month later, on July 11, 2008, oil hit its final high and shocked the world with a breathtaking 78% crash in 5 months.
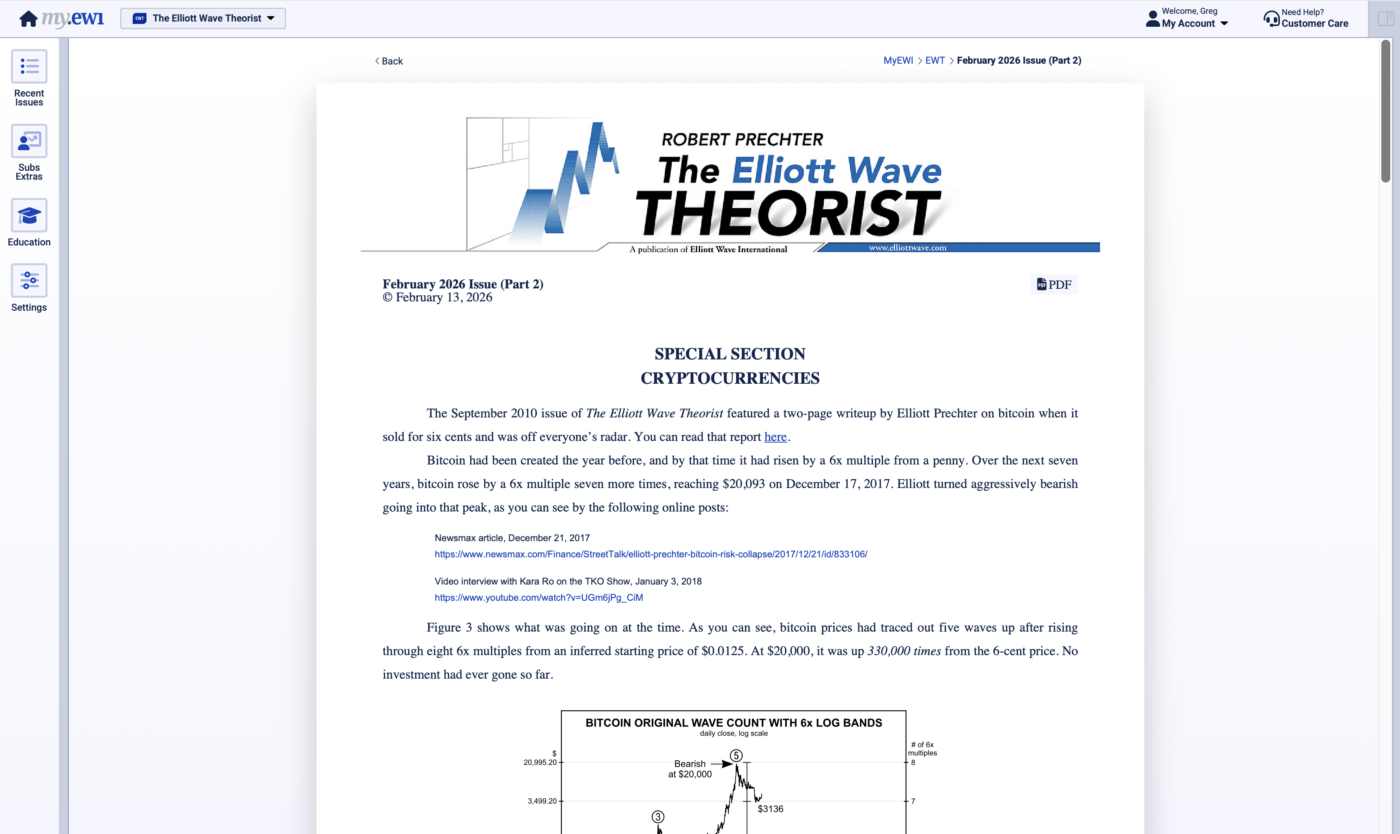
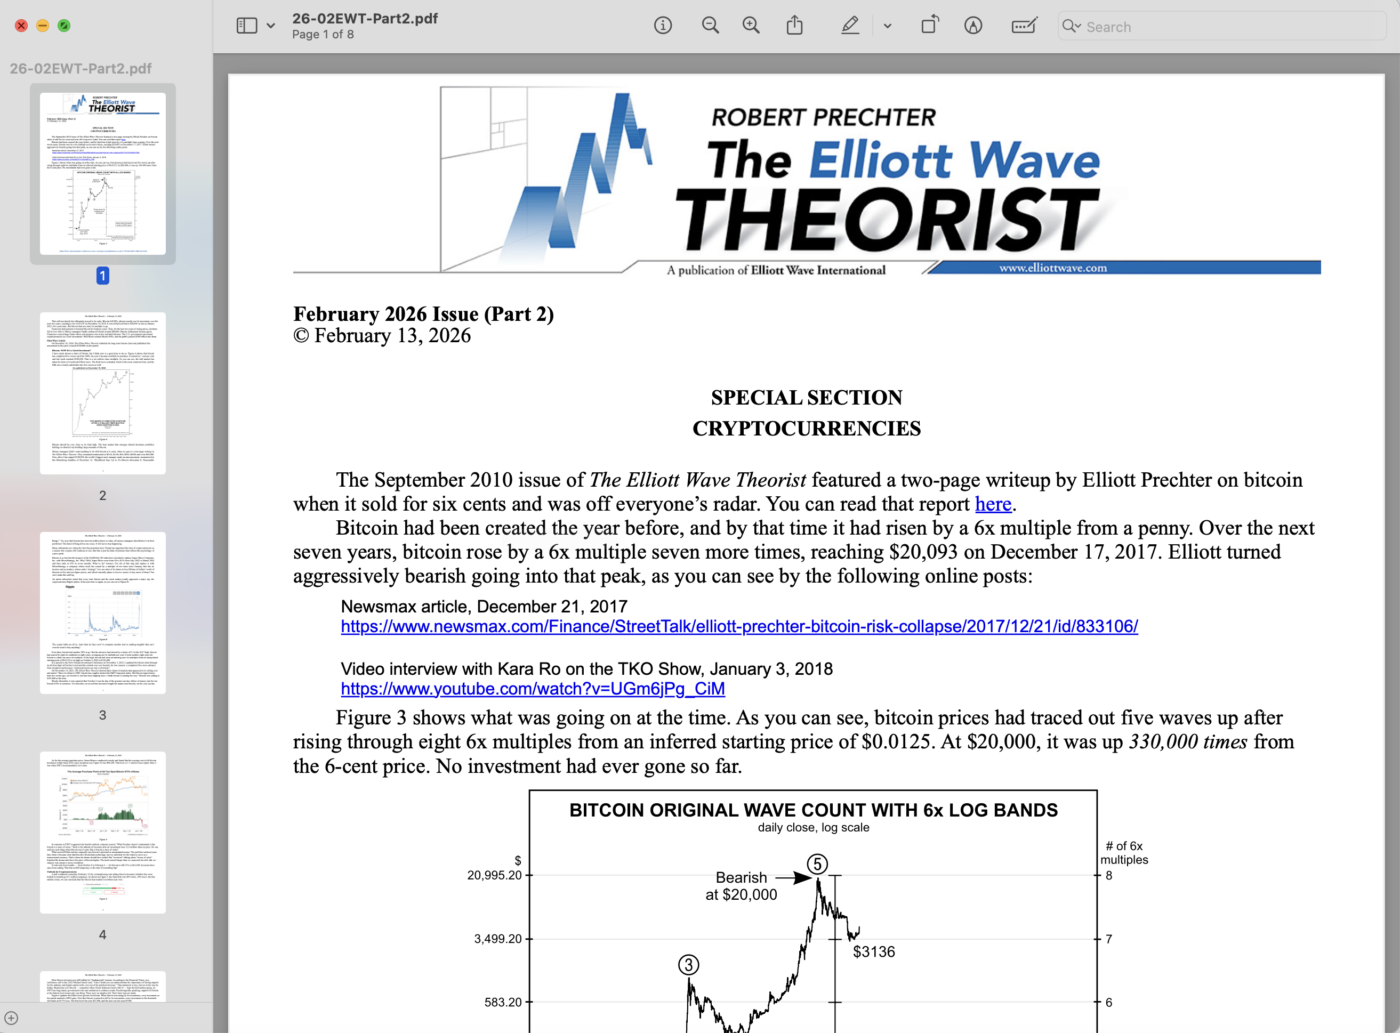
2010: Alerting Readers to Bitcoin at 6 Cents
In 2010, few had even heard of Bitcoin. The mainstream press ignored it, and “digital money” was viewed as a curiosity or a fad. In a special issue of The Elliott Wave Theorist published on September 17, 2010 we said:
Analysis/Forecast:
Bitcoin Electronic Currency:
The Future of Money
by Elliott A. Precther
“Cryptography expert Satoshi Nakamoto has created the first completely decentralized, anonymous electronic currency, called Bitcoin…
Bitcoins have the necessary features of money: medium of exchange (anonymous and across great distances), unit of account (private), divisibility (up to eight decimal places), scarcity (21 million), portability (transferred electronically), and store of value (current exchange rates – as of August 2010 – show 1 Bitcoin, or BTC, equal to 0.065 USD).
While Bitcoin appears to have enormous potential as currency, it will have to stand the test of time and the marketplace. Even if Bitcoins do not catch on in the mainstream, the structure has the virtue of providing an example of a decentralized monetary alternative. As distrust in central banks continues to increase as the financial crisis drags on, the idea of private currencies should grow in popularity.”
What Happened Next?
Unless you’ve been living under a rock, you know that Bitcoin rose from roughly $0.06 to a high over $124,000— a 2,074,000%+ increase from when The Elliott Wave Theorist introduced it to subscribers. Imagine what buying just $100 worth of bitcoin back in 2010 and holding could have meant to you.
In fact, you don’t have to imagine it – read this testimonial:
“I’m a keen subscriber to Elliott Wave Financial Forecast and Theorist. I print them out every month, sit down and read every line.
Well, Back in September 2010 I received the Theorist and read the article about Bitcoin…
I seriously thought about buying some Bitcoins. But, I hesitated... Later I cursed myself for that decision.
BUT, it got me interested in Bitcoin and the whole Cryptocurrency world. Later, in 2015, I finally took the plunge. I bought 50 Bitcoin at US$250 each.
Plus, I bought a whole raft of other cryptos: Ripple, Doge Coin, REDD coin, DASH, and etc. All of these exploded in value...
The result is that my wife and I now have a VERY comfortable retirement.
It is ALL due to the fact that I read that issue of “The Elliott Wave Theorist” back in 2010. SO, A REALLY BIG THANKS to Bob Prechter and everyone at ElliottWave.com.
— David H.
2020: Interest Rates – The End of an Era
In September 2020, the Federal Reserve assured the public that interest rates would remain near zero for years. The consensus view was that ultra-low rates would persist indefinitely — a belief reinforced by weak inflation readings and the Fed’s aggressive monetary stimulus following the pandemic shock. Here’s what The Elliott Wave Theorist said to subscribers on September 23, 2020:
Analysis/Forecast:
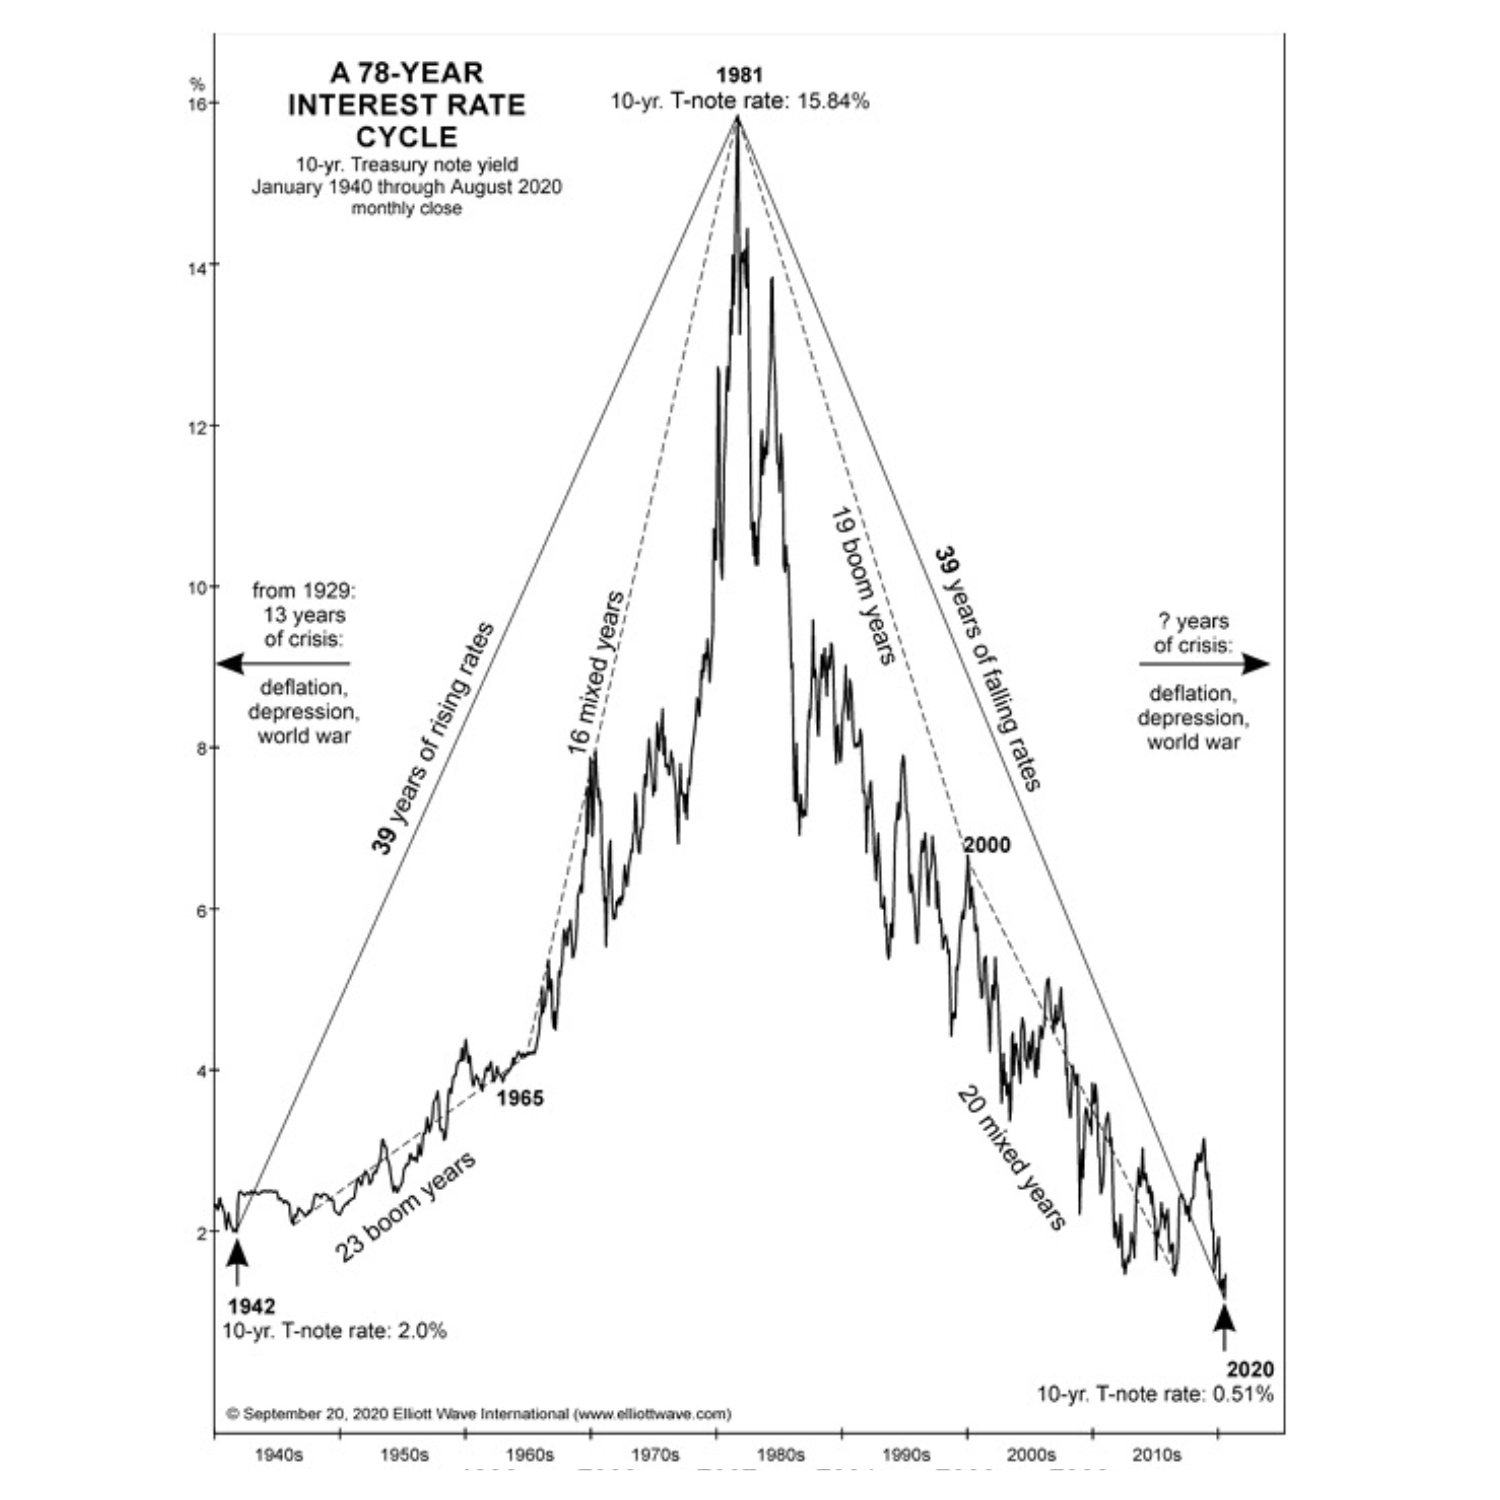
“On September 16, Fed Chairman Powell…told reporters that he expected short term interest rates to stay near zero…through “the end of 2023.”
“…there is not a chance in the world of that scenario playing out. [T]he probability is high that interest rates have begun a process of rising….
What Happened Next?
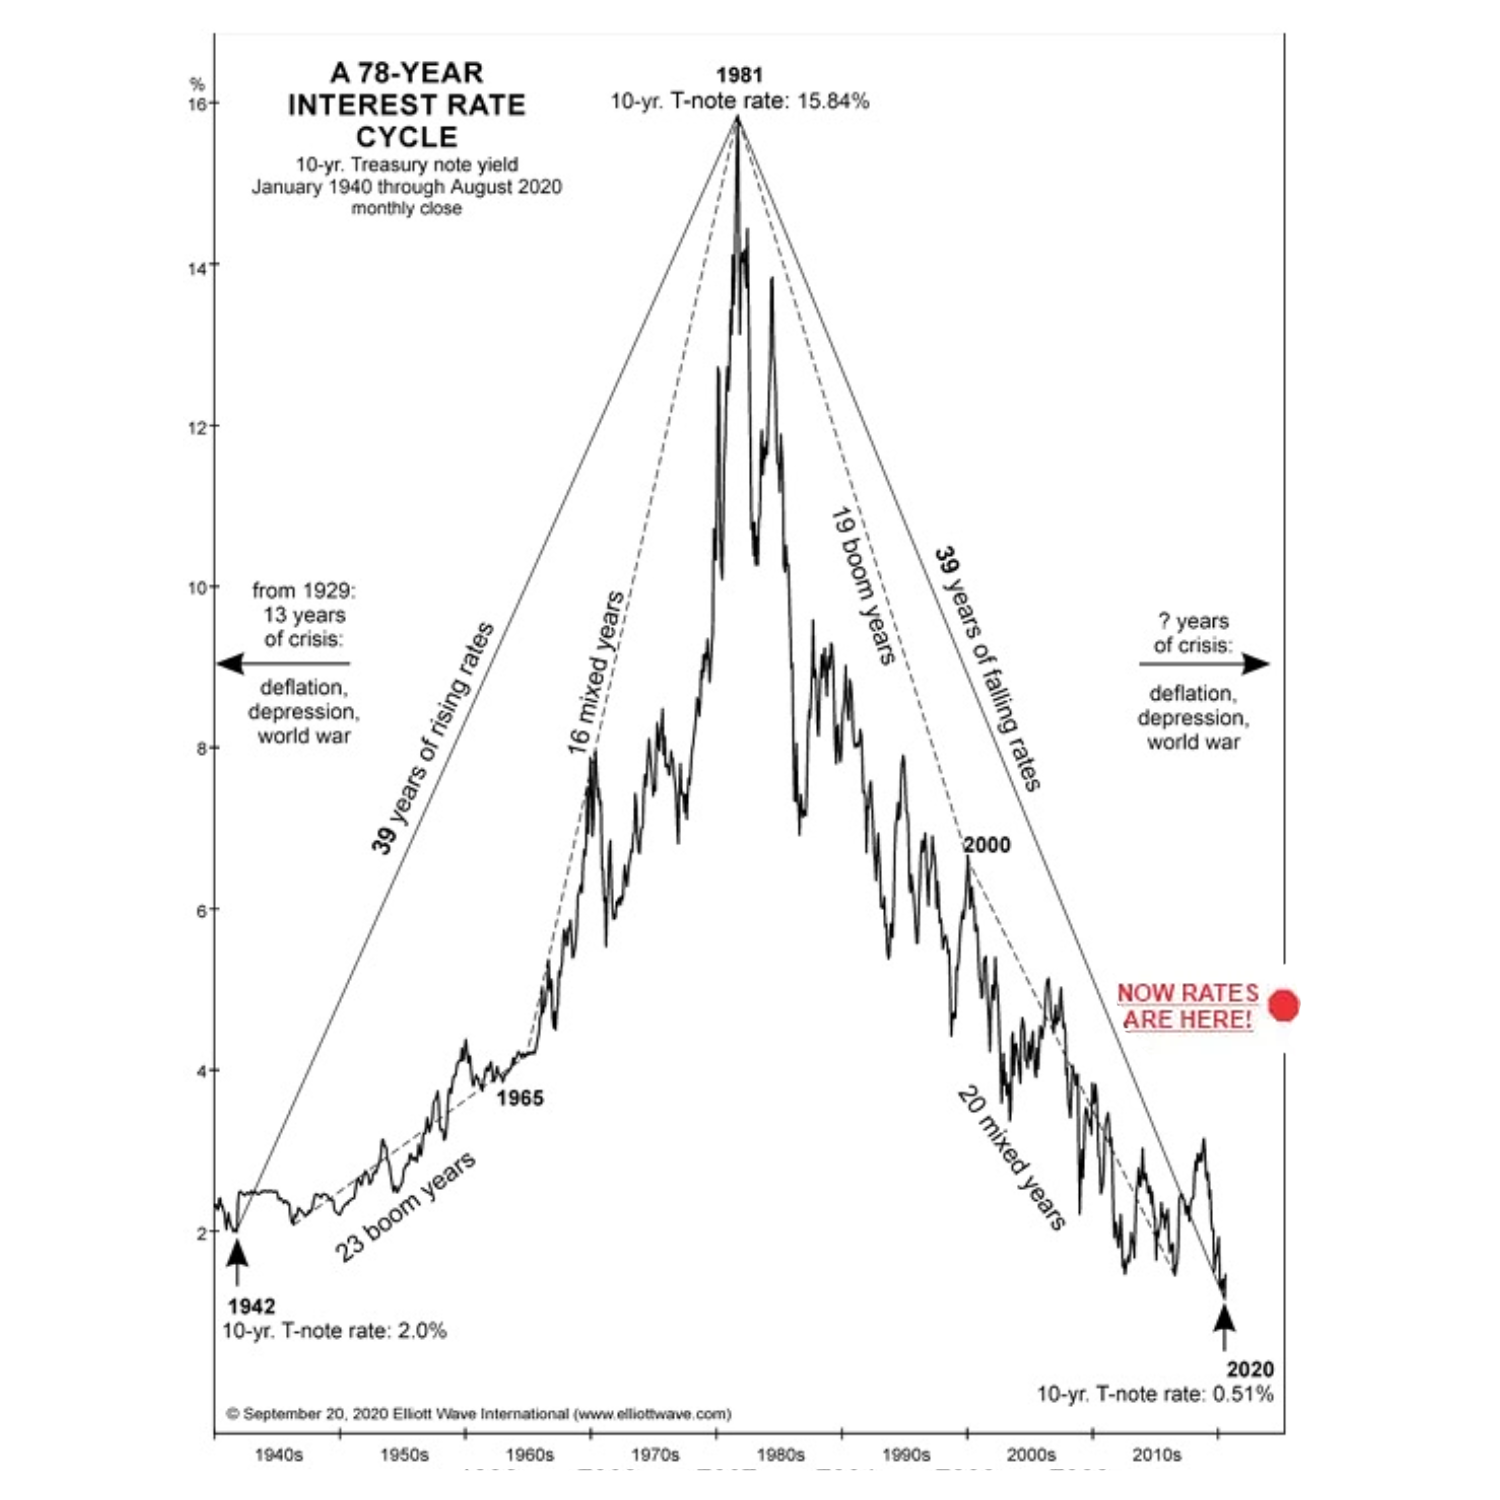
Long-term interest rates began to climb soon after. By early 2021, yields on Treasury securities were rising across the board. Over the next 18 months, T-bill rates — which had hovered near 0% — soared above 5%, marking one of the fastest rate reversals in modern history.
The forecast not only anticipated the end of a 40-year era of falling rates, but also signaled a rare opportunity for individuals and businesses to refinance, secure long-term loans, or lock in historically low borrowing costs before the sharp surge ahead.
2024: The U.S. Dollar Index
By late 2024, the U.S. Dollar Index had been climbing steadily for more than two months, with traders and commentators describing the rally as “unstoppable.” Economic data and global uncertainty fueled widespread belief that the dollar’s strength would persist well into 2025. Here’s what our Short Term Update said to subscribers:
Analysis/Forecasts:
December 2, 2024:
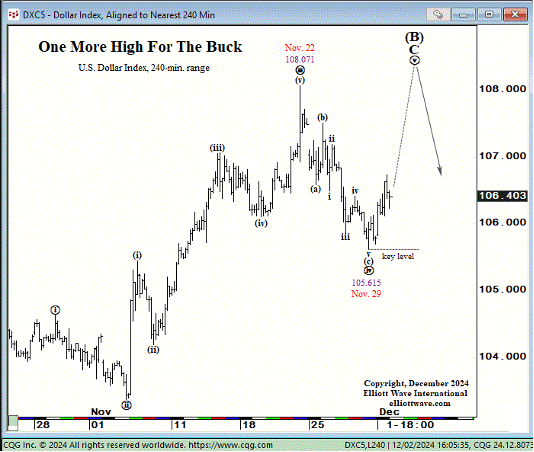
“… the Dollar Index would enjoy one more rise above 108 and then turn lower.”
January 13, 2025:
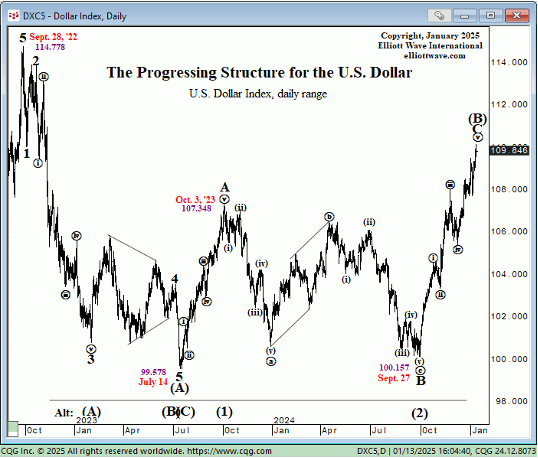
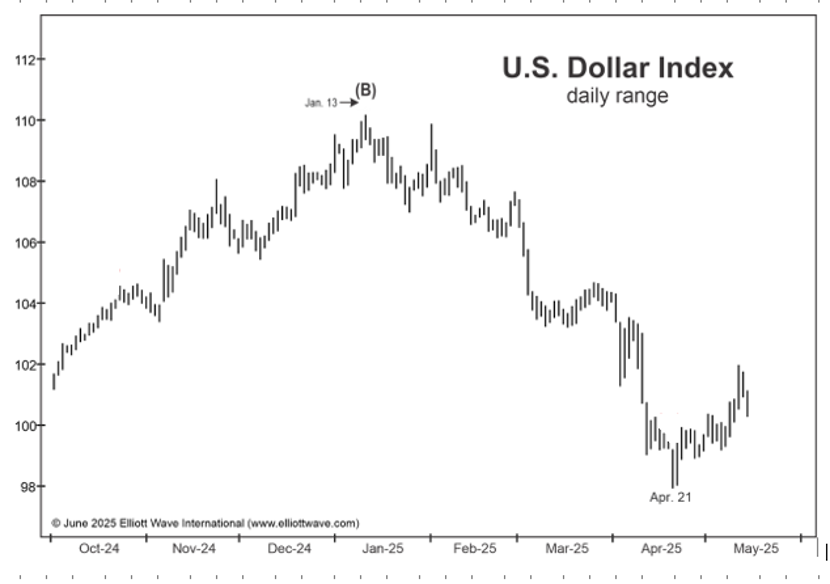
“… the next major move will be a multi-month decline that draws the index below 99.578.”
What Happened Next?
The Dollar Index peaked that very day (January 13) and then turned sharply lower, plunging below 98 by April 21 –a three-year low.
2017: Bitcoin Mania — The First Bubble
In December 2017, Bitcoin fever reached full-blown mania. Global media declared it “the future of money.” The launch of Bitcoin futures on the CME and CBOE was hailed as Wall Street’s stamp of approval. Here’s what The Elliott Wave Financial Forecast said to subscribers:
Analysis/Forecast:
December 1, 2017:
“A market that looks and quacks like a bubble is a bubble. With a surge of 1130%, no market in history has bubbled the way bitcoin has over the past 11 months…
In a classic sign of a terminating mania, even the most novice of investors is now piling into bitcoin.”
Bitcoin’s rise from 2011 should eventually be followed by a clean break of the exponential curve drawn on the chart.
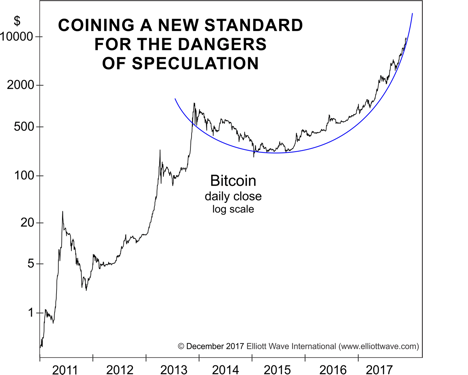
A breakdown from the bowl should lead to a bitcoin bear market…”
What Happened Next?
Bitcoin would hit its peak just 16 days later. A few days after that top, Elliott Prechter said in interview with Newsmax:
“I Wouldn’t Touch Bitcoin — Risk of Collapse Too Big.”
— Newsmax, December 21, 2017
Then, in early January 2018, our Elliott Wave Financial Forecast published a special section titled “Bitcoin: The Greatest Bubble of All Time” and said:
January 5, 2018:
“On December 1, GMP cited a ‘rising sea of euphoria, ever-higher price projections and the capitulation of financial sophisticates’ as a powerful combination of forces that would mark the demise of bitcoin’s incredible upward trajectory…
Is the bitcoin mania really over? The odds are high that it is…”
Overall, from it’s peak, Bitcoin plunged more than 80%, bottoming near $3,200 in December 2018.
By January 2019, the “crypto winter” narrative dominated — confirming the warnings EWI issued at the height of euphoria.
2026 – Robinhood Markets Inc. (HOOD)
As optimism toward the Robinhood Markets Inc. (HOOD) stock reached a new extreme, analysis from our Elliott Wave Finanical Forecast identified signs that the rally was likely nearing completion.
Analysis/Forecast:
October 31, 2025:

“…the five-wave form of Robinhood’s rally to a new all-time high on October 6 suggests its latest rise is ending. King Retail should quickly celebrate its latest position on top because it is all about to change.”
What Happened Next?
The warning proved timely:
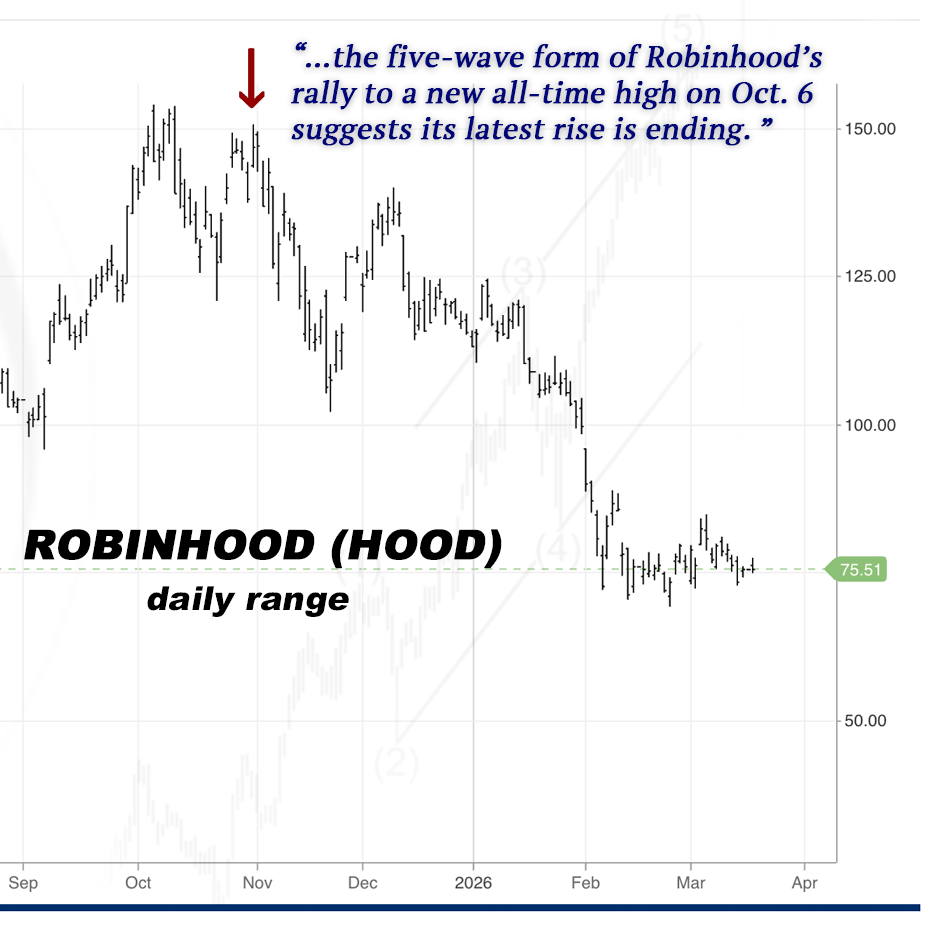
By February 24, 2026, HOOD had declined to an intraday low of $69.22 — a drop of roughly 55% from the October peak.
See What Our Analysts Are Saying Right Now
These weren’t guesses. They were Elliott wave forecasts published in real time — often at the exact turns when the crowd was most certain of the opposite.
Stay ahead of the next major move: Get our Flagship Publications >>
EWI’s Research is Trusted by Thousands of Independent Investors and Market Professionals at the World’s Largest Institutions