Elliott Wave International Master Theme.
-
Find the Earthquake on This Stock Chart
Many investors believe that a devastating natural disaster would send a nation’s stock market into a tailspin. But history shows that such a shock had only a short-term effect on equity prices. See if you can identify on a market chart when a major earthquake devastated a country in South America.
-
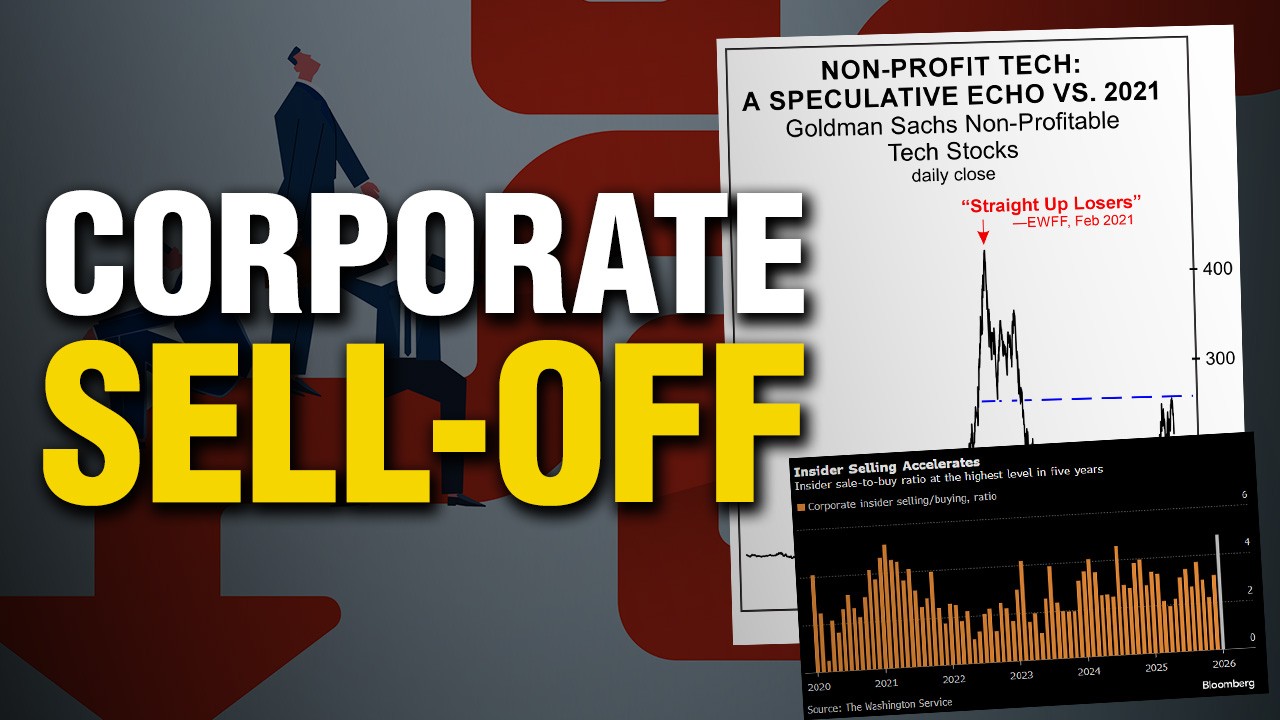
Insiders Are Sprinting for the Exit
Insiders are selling at the fastest pace in five years. Nearly five are exiting for every one buying. Here’s why that’s a red flag.
-

The Girl Scouts & Ganja!
Make way for the most unlikely partnership of 2026 thus far: the Girl Scouts of America and… a weed dispensary. We couldn’t make this stuff up if we tried.
-

A Crucial Juncture Lurking Within Worldwide Conflict?
When global chaos breaks out, the right hand-picked chart can offer investors clarity – and opportunity. That’s exactly what EWI’s Mark Galasiewski offers via a five-plus decade chart of the MSCI World Index.
-

More Price Inflation for Consumers?
That’s the question EWI’s Murray Gunn helps answer, with a Treasuries chart of 5-year minus 10-year breakeven percentage – a proven indicator of inflation expectations. Murray also puts the chart in the context of EWI’s commodity forecast.
-
KOSPI Crash – Elliott Waves Were Ahead of the Turn
South Korea’s KOSPI 200 plunged 12% in a dramatic selloff — but Elliott waves had already warned the parabolic rally was nearing exhaustion. See how our analysis identified a major turning point days before the crash.
-

The Idea that Peace and War Drive Stock Prices Is a Myth
Does an event as momentous as war affect the trend of the stock market? Most people think so. But the data don’t back it up.
-

A.I. Under Fire
If you hadn’t heard of Anthropic or its A.I. model, Claude, you have now! It just stood up to the U.S. Pentagon to insist all machine learning technology is used to protect – and not harm – innocent Americans.
-

Epic Decline, As Forecast: Japan’s Nikkei in 1989
In 1989, the world was convinced Japan’s financial dominance would last forever. We saw something different. See how our Elliott wave forecast anticipated the Nikkei’s epic 75% collapse — and what we’re tracking now.
-
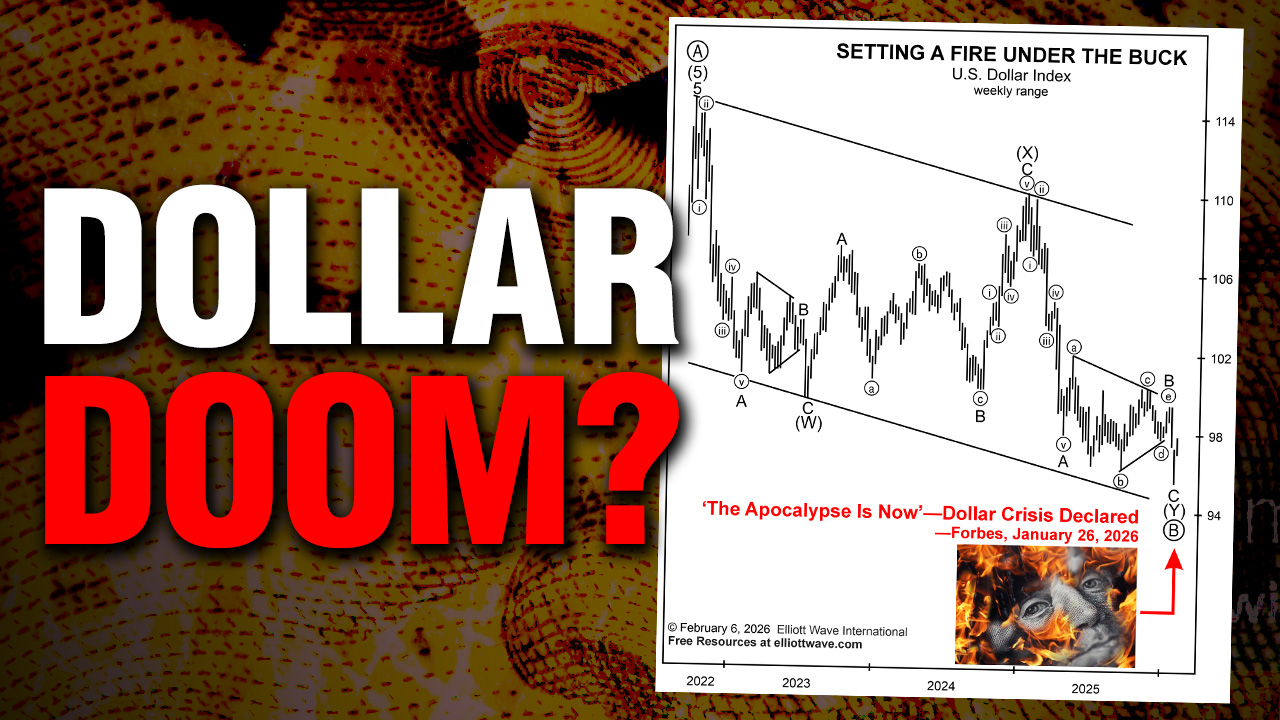
The Dollar Apocalypse?
Headlines are calling for the end of the dollar — but extreme sentiment often marks major turning points.
Got any book recommendations?