Many people have recommended Chapter 5 from Robert Prechter’s Last Chance to Conquer the Crash. We decided to post it for you free.
If you want to learn more about EWI’s unique perspective on the markets, choose one of our Must-Read Issues. We’ll send it to your inbox for free.

Chapter 5:
Government, the Fed and the Nation’s Money
The Government’s Disastrous Reign over U.S. Money
Very few people know that the United States did not create a monetary unit pegged to “buy” some amount of metal, as if the dollar were some kind of money independent of metal. In 1792, Congress passed the U.S. Coinage Act, which defined a dollar as a coin containing 371.25 grains of silver and 44.75 grains of alloy. Congress did not say a dollar was worth that amount of metal; it was that amount of metal. A dollar, then, was a unit of weight, like a gram, ounce or pound. Since the alloy portion of the coin was nearly worthless, a dollar was essentially defined as 371.25 grains — equal to 24.057 grams, or 0.7734 Troy oz. — of pure silver. In a nutshell, a dollar was equal to a bit more than 3/4 of an ounce of silver; or, in reverse, an ounce of silver was equal to $1.293.
The same act declared that a new coin, called an Eagle, would consist of 247.5 grains of gold and 22.5 grains of alloy. It valued this coin by law at ten dollars, meaning 3712.5 grains of silver. In other words, Congress, rather than allowing gold and silver to trade freely against each other, established an “official” value for gold so that 247.5 grains of gold equaled 3712.5 grains of silver. This is an exchange ratio of 15:1. A dollar was 0.7734 ounces of silver, and Congress was declaring that a dollar would buy 0.0515625 ounces of gold, so gold was valued at $19.39 per ounce.
This attempt at creating an artificial parity drove gold coins out of circulation, because the market had determined that an ounce of gold was in fact worth more than 15 ounces of silver. Still trying to establish a workable parity, Congress in 1834 passed another coinage act, changing the value of a ten-dollar gold piece from 247.5 to 232 grains of gold (plus 26 grains of alloy), thereby tweaking the gold/silver ratio closer to 16:1. Now gold was pegged at 23.2 grains, or 0.04833 ounces, per dollar, so gold was then valued at $20.69 per ounce.
Precious Metals investors should read our Metals Must-Read Issue. We’ll send it to your inbox for free.
This adjustment was no remedy, because after gold was discovered in California the market quickly valued silver higher than gold, thus driving silver out of circulation. Neither Congress nor, as we will soon see, the Fed, can repeal the laws of economics. No authority can succeed at forcing a particular value on anything.
The Mint Act of 1837 tweaked the purity ratio of gold and silver U.S. coins, making it 90%. This change edged the gold content of an Eagle to 232.2 grains, meaning that one dollar would buy 23.22 grains of gold, so gold was then valued at $20.67 per ounce. A dollar, however, was still 0.7734 oz. of pure silver.
The silver standard ended in 1873, when a new Coinage Act scrapped the definition of a dollar as a certain weight of silver and adopted a new standard based on the weight of gold, maintaining the formula of $1 = 1/20.67 ounce of gold. The Gold Standard Act of 1900 declared that gold would remain the only standard for valuing a dollar and confirmed that a dollar was 1/20.67 ounces of gold. This law put U.S. money on a gold standard.
In 1913, Congress passed the Federal Reserve Act. This act gave a special new banking corporation the monopoly power to issue dollar-denominated banknotes backed by bonds issued by the Treasury. In other words, it gave the Fed the power, in a roundabout way, to use government debt as backing to issue dollar credits to benefit the government. The Fed issued its dollar-denominated credits on dollars (gold) it never had, the government would never be obligated to make payments in gold on its Treasury bonds, and the Fed would never be obligated to pay out gold for its notes.
The Fed’s machinations diluted the supply of dollar-denominated debt, which naturally led to gold’s being worth more per dollar than the dollar-denominated credits. It took only 21 years for this scheme to create a crisis. Rather than close its pet bank to correct the situation, the government resorted to a self-serving, draconian solution to the problem it had caused. In January 1934, Congress passed the Gold Reserve Act, under which the government seized Americans’ gold, canceled all business contracts in gold, outlawed citizens’ possession of gold and reduced the amount of gold that would define a dollar. President Roosevelt personally dreamed up a new value for the dollar, which he pronounced to be 1/35 of an ounce of gold, thus making the new “price” of gold $35.00 per ounce. In one stroke, he stole 41% of the value of everyone’s dollars in a single moment, to the benefit of the government.
Because the Act prohibited U.S. citizens from trading in gold, this new, lower value of a dollar was thereafter applied only to international transactions. To maintain a domestic monetary standard, Congress simultaneously gave the Treasury the privilege of issuing paper dollar “certificates” redeemable in silver at the rate of $1.29/oz., which was its statutory value as established in 1792. With the silver price still depressed from the Great Depression, this was, for a brief time, a “fair” price. Congress passed the Silver Purchase Act of 1934 to acquire silver to back the certificates.
This new arrangement didn’t last even three decades. With the government’s continued borrowing and the Fed’s monetization of much of it, smart people began redeeming the government’s paper certificates for silver, and the Treasury’s silver stocks began to dwindle. In 1960, President Kennedy ordered the Treasury to stop printing silver certificates above $1 in value, the aim being to make it nearly impossible for citizens to gather up enough certificates to make redeeming them worthwhile. In 1961, the government’s silver stock plummeted 80% as smart people accelerated their pace of redeeming large-denomination bills. That year, Kennedy issued an Executive Order to halt the redemption of silver certificates and urged Congress to let the Fed take over the nation’s currency. In 1963, Congress obliged by passing Public Law 88-36, which revoked the Silver Purchase Act and authorized the Federal Reserve to issue banknotes unbacked by money. The U.S. mint continued to make silver coins through 1964 with what silver it had left. By 1965, the Fed had issued enough Federal Reserve notes to overrun the circulation of silver-backed U.S. Treasury certificates. That year, on July 23, Congress passed the Coinage Act of 1965, which declared that commonly used U.S. coins would henceforth contain no silver. The half-dollar coin was reduced to 40% silver. For three more years, the government paid out silver to the few people who brought in silver certificates for redemption, but it ceased doing so in June 1968, reneging on the promise printed on its certificates. The last year that 40%-silver half-dollar coins were minted for circulation was 1969.
The year 1965, then, is the key year marking the official end of metal-backed money in America. The Fed’s notes, and even the government’s old money-backed notes, became the currency of the land, unredeemable in anything. The dollar became merely an accounting unit. Americans were forced to use the Fed’s accounting units and the Treasury’s tokens for transactions or go to jail. In other words, it became illegal to circumvent the government’s program of extracting value from citizens’ savings accounts through the process of inflating by issuing debt and having the Fed turn it into banknotes and checking accounts.
Meanwhile, gold was on its own road to complete de-monetization. In 1944, the U.S. had joined a group of other political price-fixers via the Bretton Woods monetary agreement, which, as noted earlier, allowed foreign governments — but not U.S. citizens — to redeem dollars for gold at the U.S. Treasury at the rate of $35/oz. This agreement gave the U.S. government the economic advantage of issuing the world’s “reserve currency.”
It took just fifteen years for foreigners to figure out that the government and the Fed’s paper-money factory was persistently reducing the value of Federal Reserve notes, thereby raising the value of gold in relation to them. They began quietly turning in the Fed’s dollar-denominated IOUs to the Treasury and demanding gold in payment at the rate of 1/35 of an ounce of gold per dollar. Just as silver had flowed out of the Treasury in the early 1960s, gold began flowing out of the Treasury in the late 1960s, but this time it went overseas. For a dozen years, Congress allowed foreigners to raid the U.S. Treasury, leaving Fed-note holders with increasingly devalued currency and foreigners (and perhaps insiders) with most of the government’s gold.
In 1968, President Nixon issued an Executive Order reducing the official value of a Fed-owed dollar to 1/38 of an ounce of gold, thereby raising the “price” of gold to $38.00 per ounce. This feeble attempt to stem the tide lasted only three years.
Finally the government had to admit that its monetary ruse had failed. In 1971, Nixon issued Executive Order 11615, which reneged on the government’s obligation to pay out gold to foreign holders of the Fed’s IOUs. Speaking on television on August 15, the President explained, “The effect of this action…will be to stabilize the dollar.” What it really did was complete the eight-year transition during which the term dollar was transformed from indicating a specific amount of money to indicating nothing but an accounting unit, thus profoundly destabilizing it.
In 1972, the official value of a Fed-owed dollar was again lowered by statute, this time to 1/42.22 of an ounce of gold, making the gold “price” $42.22 per ounce. This price was a fiction at the time and still is, but it remains on the books to this day.
In that same year, central banks announced that they would no longer pretend to equate their accounting units to any amount of money but allow them to trade at whatever the market said they were worth. This announcement set governments and central banks completely free to create and spend new accounting units at their pleasure. The Fed’s banknotes were still written against Treasury bonds, but no longer would the Treasury’s IOUs be paid in gold, silver or anything else, to anyone.
The United States dollar had been approximately a twentieth of an ounce of gold or had been redeemable for that amount of gold for 142 years. Following the government’s seizure of citizens’ gold in 1934, the dollar was again redeemable in the original amount of silver, but it was newly valued at only a thirty-fifth of an ounce of gold. The original dollar, therefore, essentially managed to maintain parity to 0.7734 Troy oz. of silver for 173 years. Then, from 1963 to 1971, Congress through a series of new laws ceased exercising its Constitutional “power to coin money [and] regulate [make regular] the value thereof.” Instead, it outlawed money and replaced it with an elastic (non-regular) unit of account.
The only reason people use the Fed’s money-substitute is that the government prohibits all forms of real and alternative money. It requires that all transactions, including the payment of taxes, be denominated in the Fed’s accounting units, which, although no longer dollars, are still called dollars.
Section 19 of the original 1792 Coinage Act made the following declaration: “…if any of the gold or silver coins which shall be struck or coined at the said mint shall be debased or made worse as to the proportion of the fine gold or fine silver therein contained [by act of] any of the officers or persons who shall be employed at the said mint…every such officer or person…shall be deemed guilty of felony, and shall suffer death.” All members of Congress since 1963 — for passing and then failing to repeal Public Law 88-36 — are de facto guilty of having “debased” and “made worse” the dollar, but they have hidden behind technicalities in cleverly crafted laws, which shroud the effect of their acts.
The Era of Money vs. the Era of Unbacked Accounting Units
The change wrought by fake money is far, far worse than you might think. Let’s look at the timing of the government’s abandonment of money.
For 173 years, as detailed above, the United States was on a money standard. Congress shifted the basis of the money standard between silver and gold twice during that period. In the fateful year of 1965, shortly after authorizing the Federal Reserve to issue notes as currency, Congress abandoned money altogether and authorized the Fed to provide the nation’s accounting units in place of money, and the Treasury to issue tokens in place of money, all without any standard at all and anchored to nothing. Officials still call the new unit of account a “dollar” and “money,” but they are inaccurate on both counts. Or, one might say, they “re-defined” these terms; but they did so without telling anybody plainly what the change meant. Although a few nuances attend U.S. monetary history, broadly speaking we may delineate the key periods as follows:
1792-1873: silver money standard
1873-1934: gold money standard
1934-1965: silver money standard
1965-present: Federal Reserve accounting units
(no standard).
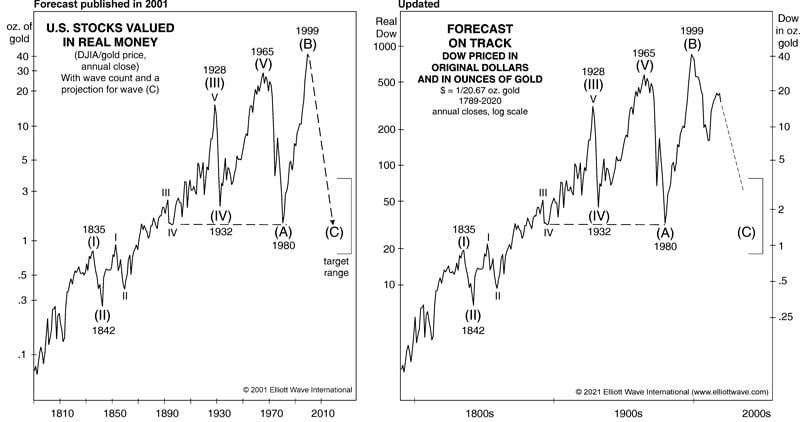
The year 1965 is not just any old year. It is the year that we have long recognized as the orthodox end of the great bull market in the Dow/gold ratio in Elliott wave terms. Figure 5-1 shows this wave labeling, which we first published in early 2001, and Figure 5-2 brings the wave pattern up to date. Thus, the true bull market in stocks from the late 1700s until 1965 attended conditions under which the country would prosper, the most important of them being a money standard. When the bear market started after 1965, conditions shifted to reflect a subtle trend toward the negative psychology of a bear market, one important result of which was the abandonment of a money standard.
(1965 was also the year of Medicare, which inaugurated a trend toward deterioration in the quality and affordability of U.S. medical services. Medical services went from almost an entirely free market, with extremely low costs and nearly universal availability — including “house calls” by doctors! — to a market distorted by third-party payers and ossified by thousands of laws and insurance company rules. That trend isn’t over, either.)
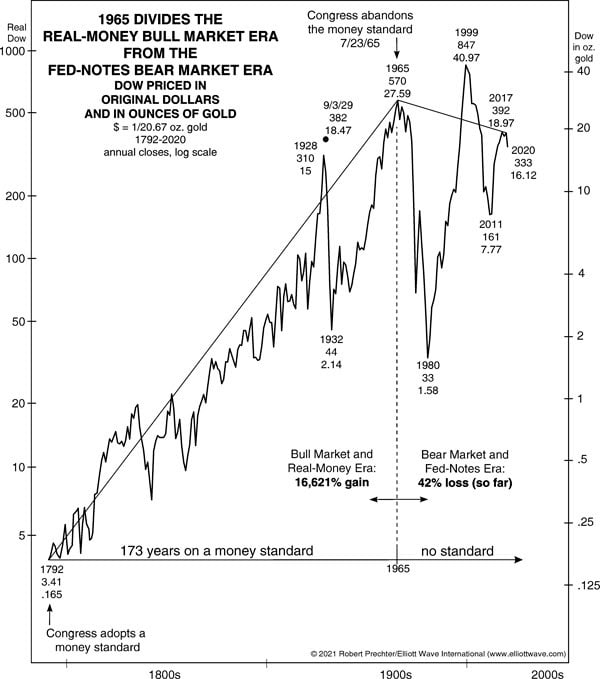
Figure 5-3 is a chart you have not seen elsewhere. It details the breathtaking rise in U.S. corporate worth during the bull market period and exposes the net destruction of U.S. corporate worth since the bear market started. The year of the bull market top is when the government shifted the foundation of value for the nation’s accounting unit from money to the whims of politicians and central bankers. The difference in result is stunning: From 1792, when a money standard was first made official, to 1965, when Congress abandoned the money standard, the U.S. stock market rose from being worth .165 ounces of gold to being worth 27.59 ounces, a difference of +16,621%. Since 1965, when the government abandoned the money standard, to the end of 2020 — despite record highs in nominal terms — the U.S. stock market has had a net decrease in value from 27.59 ounces of gold to 16.12 ounces, a difference of -42%.
Had the old trend continued at its preceding average pace, the Dow at the end of 2020 would be up 409% since 1965 instead of down by 42%; and since 1792 it would be up 85,031% instead of up 9,670%. Of course, social mood is in charge of these values, so I do not believe that the Dow would be worth that much; it would be worth just what it is today in gold-money terms. But the difference does reveal the occasional trait of a bear market to hide its true consequences, including destructive decisions made by the political class.
The only reason people do not know the country’s true stock market history and its current real worth is that the massive inflating of accounting-unit dollars has caused a reduction in the value of the accounting unit, which in turn has masked the devastation of U.S. stock values. But Figure 5-3 tells the truth: The bull market ended in 1965; the bear market — which includes a brief run to a new high in 1999 — has been raging ever since; and the accounting-unit monopoly engineered by the government and the Fed has been an intimate factor in the trend toward the financial and economic destruction of what was formerly the most prosperous country on earth.
Despite our delineation of the money era from the Fed-note era, the Fed deserves only part of the institutional blame for the monetary and economic effects of the bear market. Congress is primarily responsible for bloating credit and for burdening the economy, by means of its debt engines (FNM, FMAC, GNMA, FFCBFC, FHLBs, student loans), speculation guarantees (FDIC, FSLIC, bank and corporate bailouts), regulations (OSHA, EPA, EEOC, etc.), taxes (income tax, social security tax, inheritance tax, gift tax, capital gains tax, excise tax, gas tax, medical tax, etc.) and criminalization of enterprise (via thousands of state and local “licensing” laws and business regulation). But the Fed has helped finance it all. By providing an inflatable accounting unit, the Fed made it easier for the government and its friends to extract purchasing power from dollar-holders, with very few being the wiser. This activity has paralleled the dramatic shift of trend in 1965, from 173 years of mostly rising corporate worth to 56 years of net stagnation and decline, with the worst of it yet to come.
True Stock Values
So, why does everyone seem to think that the country is prosperous? The Dow is closing in on 36,000! The S&P is nearing 4700! But, of course, they’re not. In less than a century, government through its debt-creating engines and the Fed through its monetary policies have managed to reduce the value of the original dollar by almost exactly 99%. From the dollar’s original value of 1/19.39 of an ounce of gold in 1792-1834, it slid all the way to 1/1921.5 of an ounce in 2011 and remains near that level today. So, everything today is dollar-priced nearly 100 times where it would be had the dollar retained its original worth.
As you can see in Figure 5-3, the true price of the Dow at year-end 2020 was not 31,000 but 333. This is not a made-up figure. This is the Dow’s true price. That’s the price commentators would be citing had the dollar maintained its purchasing power in terms of gold. The Dow at year-end 2020 was worth less than what it was at its peak in 1929, 91 years earlier. The government and the Fed have succeeded in issuing money and facilitating the expansion of credit, thereby obscuring true values and keeping people complacent, even giddy, over their “gains” while they are in fact just spinning their wheels.
The Dow’s Seemingly Low Real-Money Price Does Not Portend More Gains Ahead
One might look at Figure 5-3 and think that the Dow is cheap in real terms, so it has nowhere to go but up. But thinking so would be to underestimate mightily the destruction that the government has wreaked on the U.S. economy.
Incredibly, the year-end 2020 price of the Dow — 16.12 ounces of gold, or 333 original dollars (normalized to 1837-1933’s 1/20.67 oz.) — is ridiculously expensive for what you get: a lousy 1.8% annualized dividend yield, even lower than it was at top tick in 1929; the S&P’s P/E ratio in the high end of the range for the past century and four times what it was at major bear market bottoms of the 20th century; and the S&P’s 4.89 price-to-book-value ratio (adjusted to the pre-2004 data series), which is two to four times its range from year-ends 1929 through 1987. In other words, stocks are not cheap; they are historically overpriced. At the same time, stock-market optimism in 2021 is even more extreme than it was at the Dow’s all-time record overvaluation in 2000. The miserable value shown at December 2020 in Figure 5-3, then, comes from a snapshot of the Dow at its greatest overvaluation in history while enjoying its all-time greatest degree of bullish sentiment. This condition virtually assures that the worst of the devastation of U.S. corporate worth still lies ahead.
Has the Fed Produced Net Benefits?
People speak of the Fed “buying” assets, but it can’t buy assets, because it produces nothing of value with which to trade. Congress conferred upon it a monopoly privilege to manufacture new banknotes and swap them for the debts of others, primarily the U.S. government. By this method, the Fed stealthily transfers the stored effort of savers to the issuers of the bonds for which it swaps its new credits, primarily the government. In conjunction with the FDIC, it has benefitted profligate bankers in the short run by enabling them to make profits on dubious loans. It has also bailed out reckless speculators, allowing them to avoid accountability. But in doing so it has sucked value out of all dollar accounts and burdened the American economy.
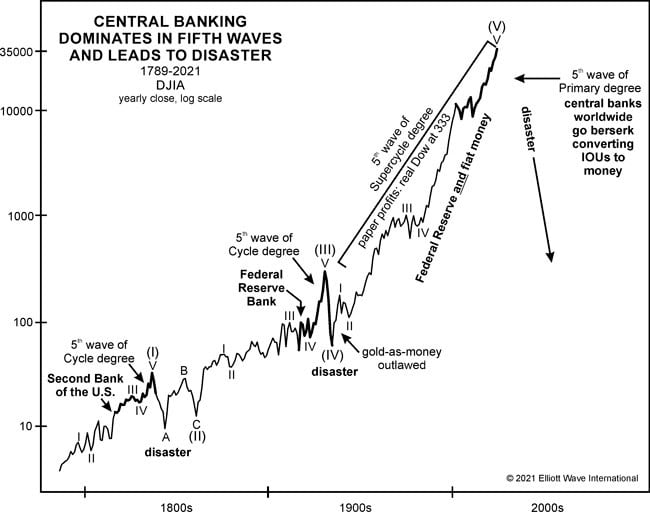
Some people would argue that the Fed has produced net benefits in having contributed to prosperity. I do not agree with that opinion. Regardless, we can certainly recognize the fact that periods of central banking have always led to disasters. This has been the case since the first experiments in central banking that helped foster the South Sea Bubble in England and the Mississippi Scheme in France in the early 1700s, each of which led to a crash and widespread bankruptcies. Figure 5-4 shows the history of central banking in the U.S. as it relates to the stock market. The Second Bank of the United States was chartered in time to participate in wave V of (I) in the early 1830s, and the aftermath was two crashes and depressions, ending in 1842 and 1857. Today’s Federal Reserve Bank was chartered in 1913, in time to participate in wave V of (III) in the 1920s, and the aftermath was a crash and the Great Depression, which ended in 1932-33. This time, the government left its monopoly bank in operation, and it has participated in wave (V) from 1932, and especially wave V of (V) since 1982, and even more especially — along with its activist central bank brethren worldwide — in wave 5 of V of (V) since 2009. The outcome will be no different this time: disaster.
The Main Beneficiary: Government
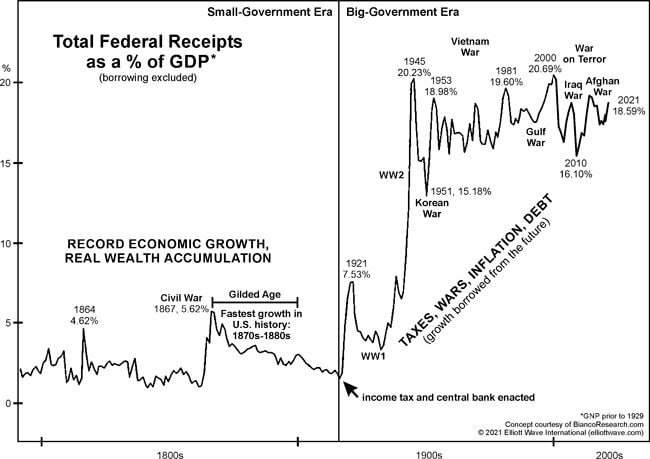
Figure 5-5 confirms that the era of big government began upon the passages of the Federal Reserve Act in 1913 and the Income Tax in 1916. From that time forward, the United States ceased being a free, “isolationist” (i.e. non-interventionist), prosperous country with a stable currency and became a nation of taxation, inflation, regulation, debt and foreign wars, all of which are activities that reward the politically connected classes.
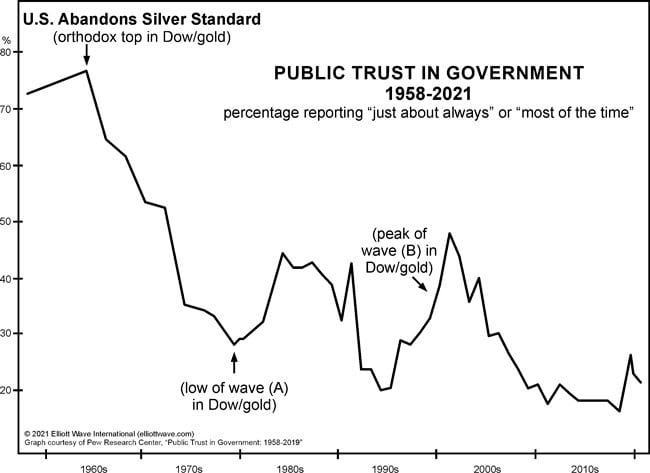
It has not been a total win for the state, though. Its abandonment of real money in 1965 (per Figure 5-3) coincided with a profound shift in U.S. citizens’ trust in government, as you can see in Figure 5-6. So, while the political class has benefitted in wealth and power from the corruption of money, it has also lost respect.
Deflation Ahead
The next big monetary event will not be more inflation but deflation, as the huge quantity of accounting-unit indebtedness, built on a foundation of accounting-unit indebtedness, becomes unpayable and contracts.
Debt measures the amount of otherwise-future consumption that has already been consumed. One should not be shocked at the looming prospect of the present consumption rate collapsing. People have already borrowed it all and consumed it all, while promising to pay it back. Those debts will be repaid, through involuntary austerity.
This NYT Bestseller is your guidebook for safety during a time of a financial crisis and economic depression. It offers a unique set of secrets for financial survival and specific recommendations for a safe bank, offshore gold storage, a second passport and more. Buy the book now.