On April 6, this is what our Intraday Currencies Pro Services subscribers were looking at in AUD/JPY:
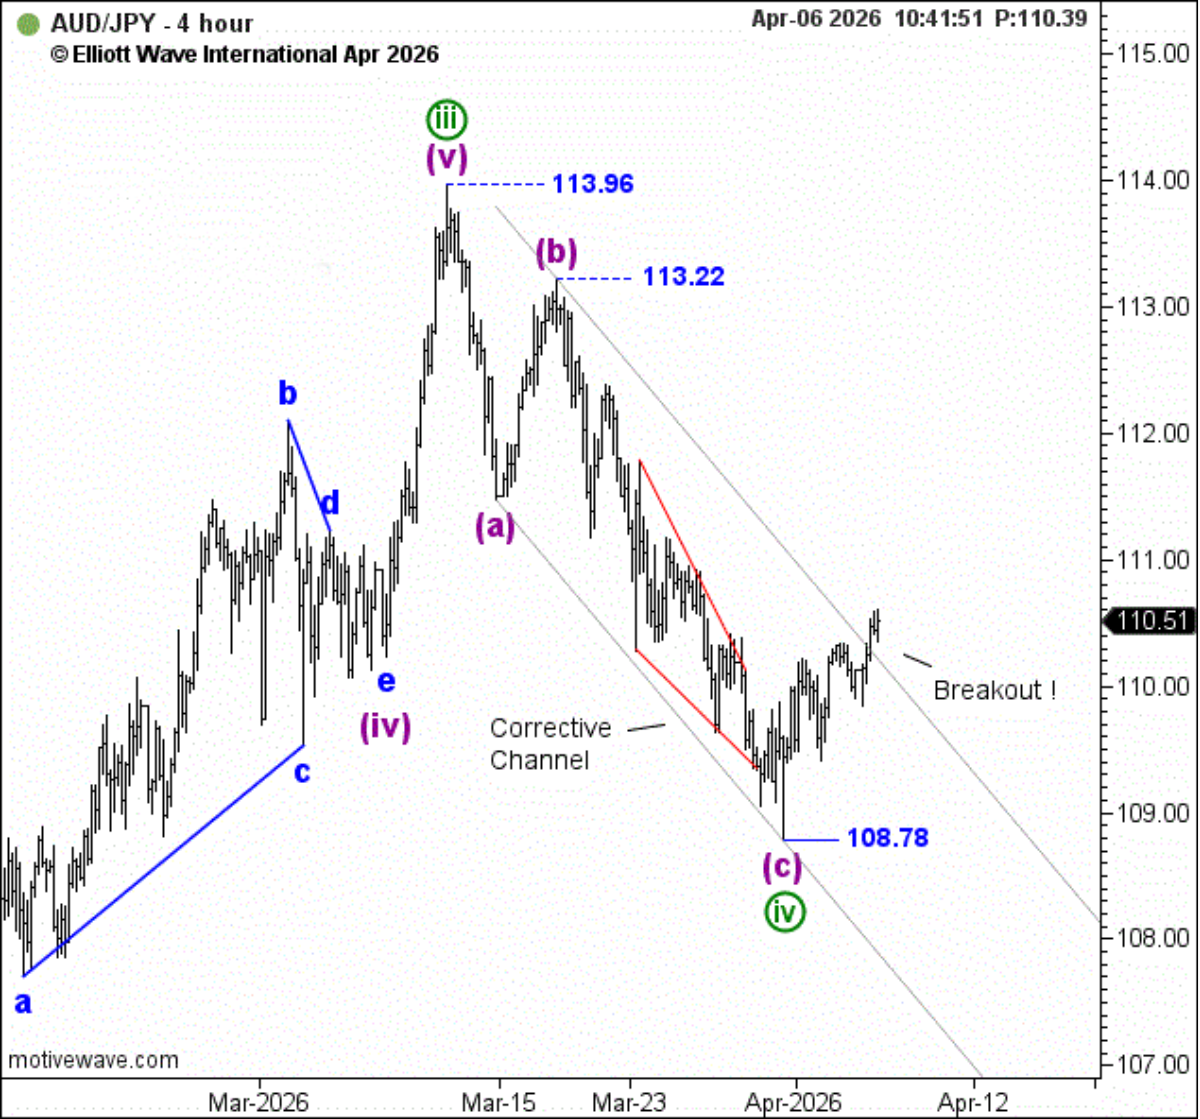
The analysis showed a completed zigzag correction, labeled (a)-(b)-(c).
More importantly, wave (c) had taken the form of an ending diagonal — a pattern that often signals trend exhaustion.
That matters because ending diagonals:
- Typically appear at the end of a move
- Show waning momentum
- Often precede a sharp reversal
With that structure in place — and a breakout from the corrective channel — our analyst identified the correction as complete at 108.78, pointing to the potential for an impulsive rally.
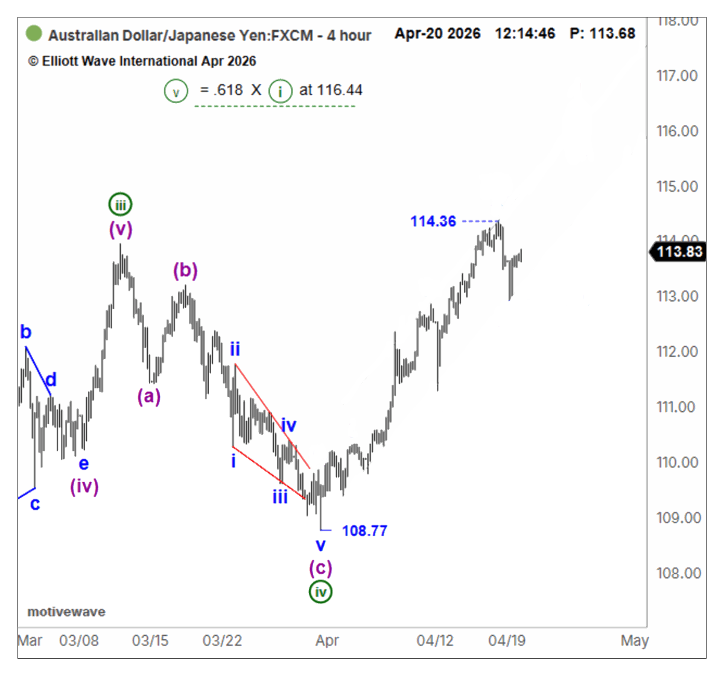
What Happened Next?
That’s exactly what followed as AUD/JPY rallied to above 114.36.
This real-time forecast shows how Elliott wave analysis can help you identify developing structures — and spot potential breakouts as they begin, not after the move is already obvious.
Whether you’re focused on 4-hour charts or long-term trends, these patterns unfold across all timeframes. The question is: which ones are you watching?
Get Our Forecasts:
This wasn’t hindsight — it was recognizing a completed structure and emerging opportunity in real time. Here are some options to get started:

 Pro Services
Follow intraday, daily, and weekly wave setups with ongoing updates through Pro Services.

 Global Market Perspective
Get monthly forecasts across currencies, global stock indexes, bonds, metals, crypto, and more with Global Market Perspective.