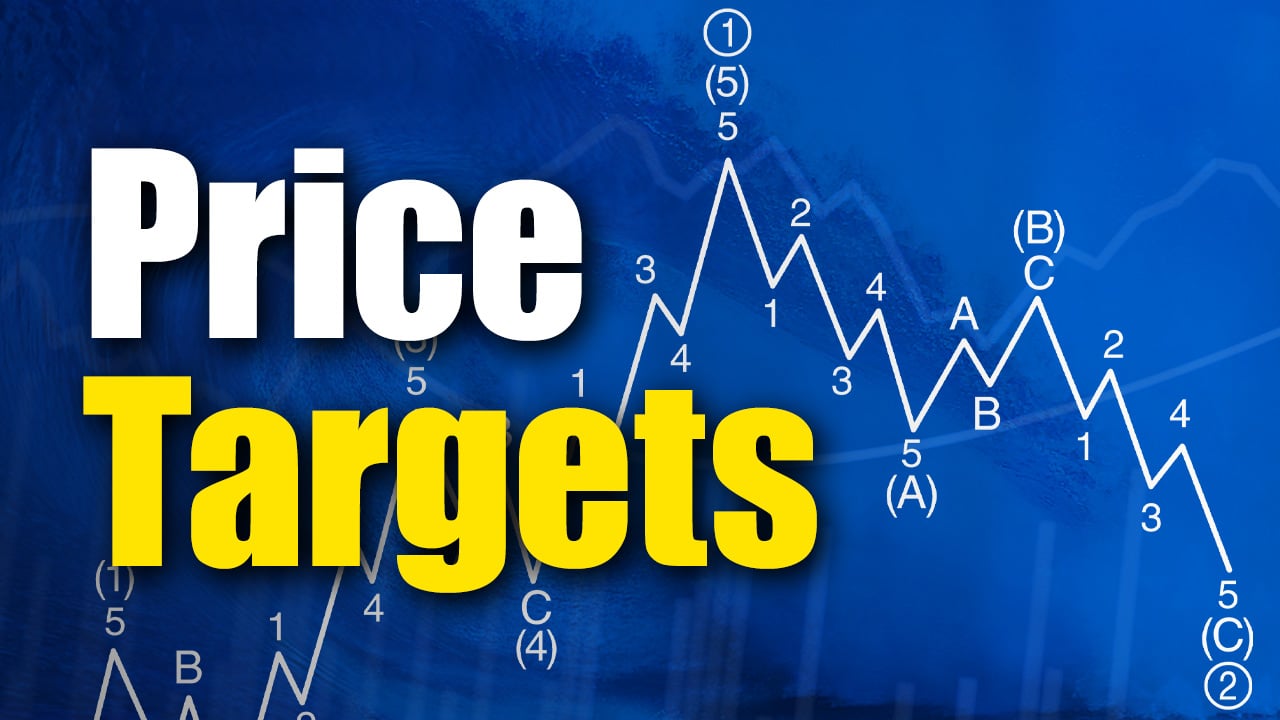
In Elliott wave analysis, wave 3 is typically the strongest and most directional move within a trend. When it unfolds, price often accelerates as momentum builds and sentiment shifts decisively.
This is why identifying the end of wave 2 is critical — it can signal the start of that next powerful move.
In a Crypto Pro Services update on October 15, 2025, our analyst Jason Soni showed this chart to subscribers and outlined a developing setup in MicroStrategy (MSTR).
At the time, he showed subscribers this chart and noted:
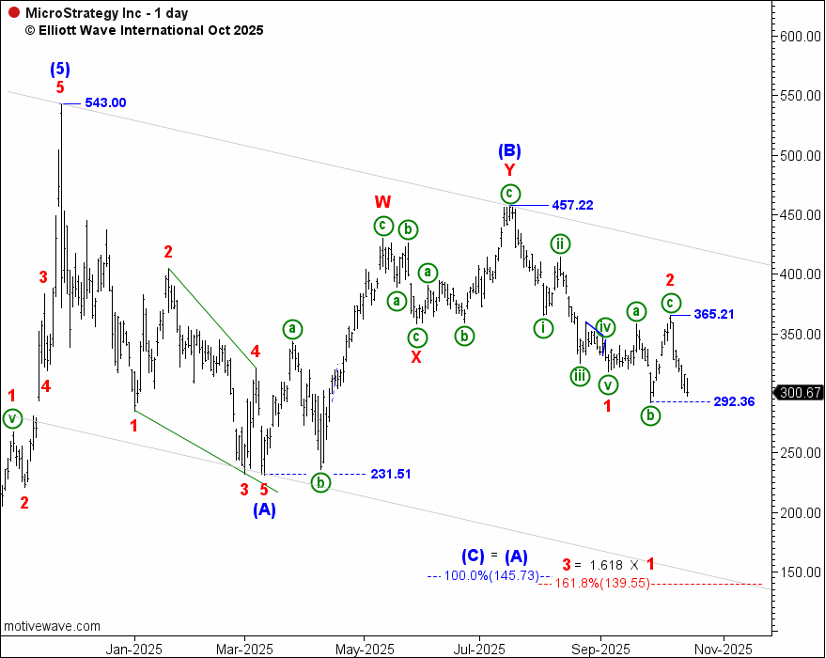
“Favoring that wave 2 ended at 365.21, we’re looking for a swift decline in five waves to complete wave 3.”
What Happened Next?
Following that analysis, MicroStrategy declined sharply. At the time of the October forecast, MicroStrategy was trading near $300.67. As the wave structure unfolded, price declined to $104.17 by early February — a move of roughly 65%.
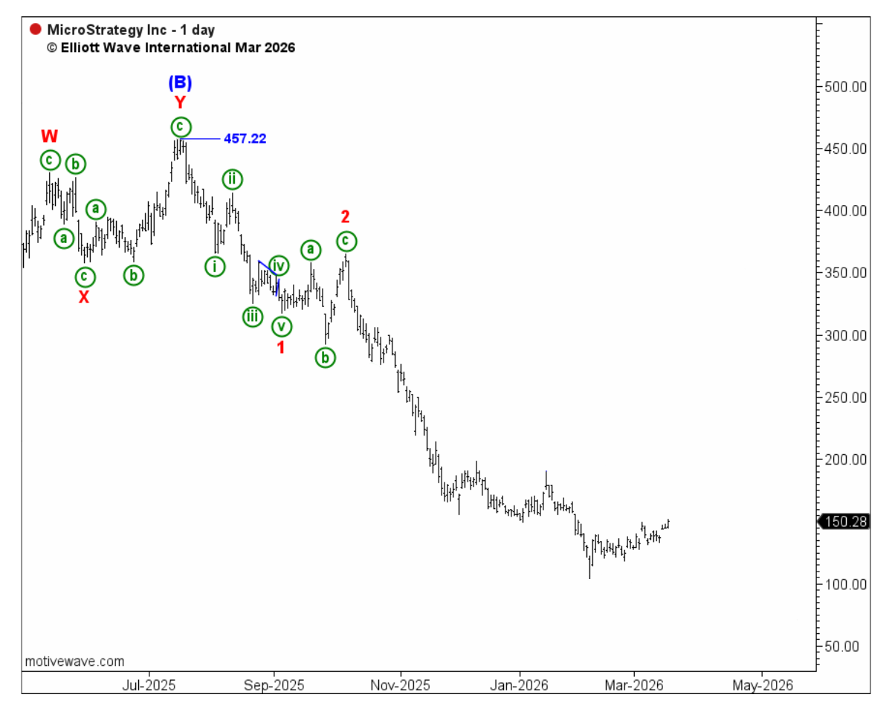
This real-market example highlights how Elliott wave analysis can help identify when a market may be transitioning into a powerful trending phase.
For ongoing crypto analysis and developing opportunities, you have three options:
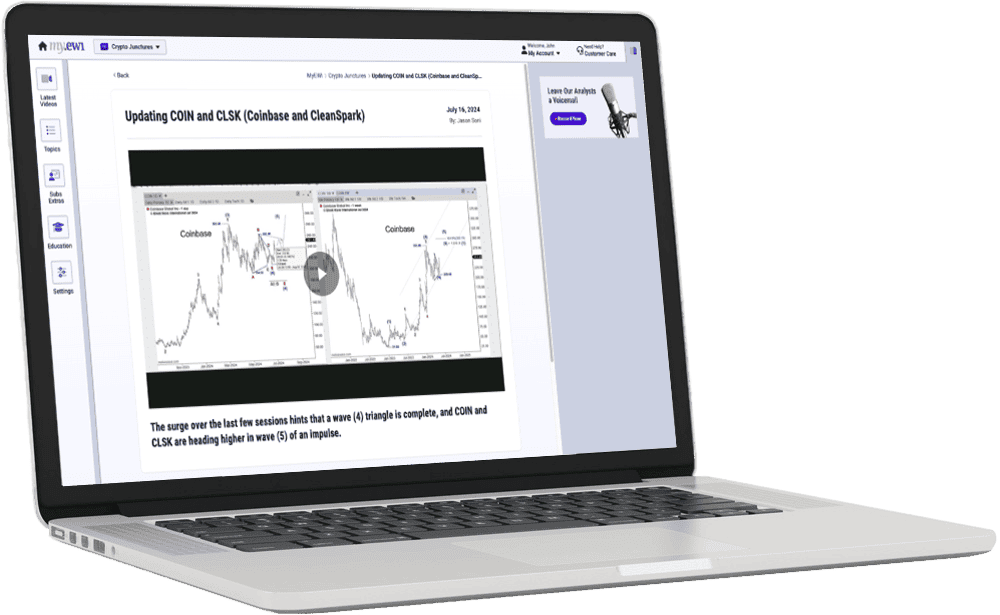
 Crypto Junctures Weekly Videos
Track developing setups across key crypto markets, with weekly video updates and a live monthly webinar where you can ask questions directly to our analysts. $97/mo.

 Pro Services Intraday, Daily, and Weekly Coverage
Our Crypto Pro Services help you follow wave structures as they evolve with timely updates across crypto markets — plus access to a live monthly webinar with direct analyst guidance. Coverage starting at $267/mo.
 Global Market Perspective Monthly Coverage
Get the big-picture view across global markets, including cryptocurrencies, with forward-looking analysis of trends, investor psychology and potential turning points. $77/mo.
New to Elliott wave?
If you’d like to learn more about Elliott wave analysis, explore our educational resources and see how these principles are applied across real-world markets.