
Murray Gunn is Head of Global Research at Elliott Wave International and editor of Global Rates & Money Flows and European Short Term Update, as well as a contributor to Global Market Perspective. He brings decades of institutional investment experience to his analysis, having managed global bonds, currencies, and equities at Standard Life Investments and the Abu Dhabi Investment Authority, before serving as Head of Technical Analysis at HSBC Bank.
Hello Murray! So when England won at Wembley in 1966, a premium seat for the World Cup final cost about $10.46. Sixty years later, a premium ticket for this month’s final in New Jersey runs the equivalent of $10,000. Is New Jersey that much more expensive than Wembley?
Ha! I don’t think it’s about the location. It’s more about the decline in the value of the US dollar. A buck in 1966 and a buck today are different animals. That’s why instead I looked at football prices (soccer, to you Americans) in terms of ounces of gold not a fiat currency.
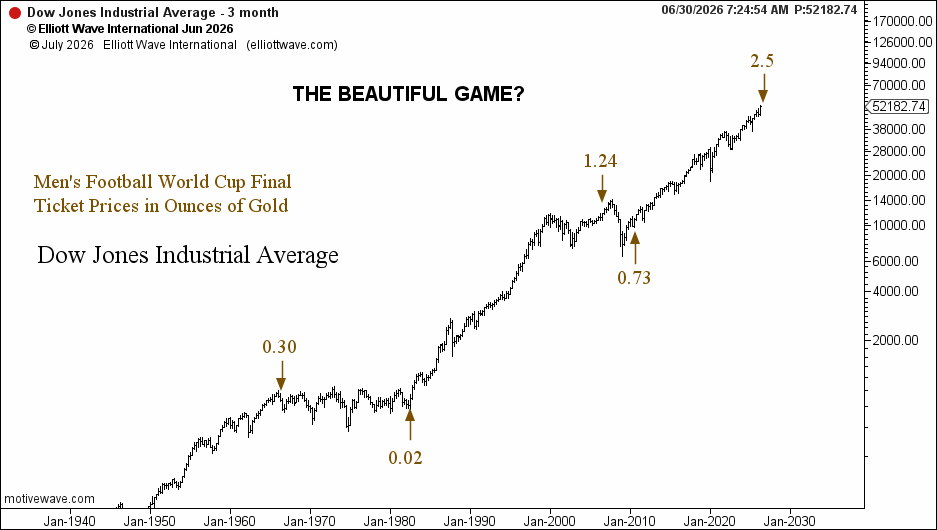
I showed Global Rates & Money Flows readers this chart of the Dow Industrial Average going back to the 1940s. And 1966 stood out for two reasons: 1) Well, as my English friends have reminded me my whole life, it was the last time they won the World Cup, but 2) It was also a major, major peak in the Dow, also a great proxy for global risk assets, which was followed by a devastating, multi-year bear market.
That got me thinking that there might be a connection, so I plotted the price of various World Cup final tickets, in ounces of gold, that were proximate to important market junctures. And, I saw a very interesting pattern evolve.
OK, we’re intrigued. What pattern?
Let’s walk through it. Start at 1966, .30 ounces of gold. Sixteen years later, 1982 — and that low is much more prominent when the Dow is also priced in gold — Italy beating West Germany in Spain — and a ticket to the final match cost only 0.02 ounces of gold. Seven percent of what it was in 1966! That’s amazing.
Explain further?
1982 was the great generational low for stocks, the launchpad for the bull market that followed. Then, in World Cup 2006, a seat at the final cost 1.24 ounces of gold — near the zenith of the last great financial bubble, a year before the 2008–2009 crash. By the 2010 game, a seat was much less.
So, the price of the ticket follows the price of stocks?
Close, but not exactly. They each reflect the dominant social mood as it swings from optimism to pessimism and back again. Thus, now in 2026, a seat to the final costs 2.5 ounces of gold, just as the Dow and many other nominal global stock indexes are trading at or near record highs.
The same crowd optimism that empties wallets for a football match is what drives markets to extremes.
Is there a message here for investors or is this just a fun observation?
The sentiment is exactly what you’d expect near a peak, and the market patterns we’re tracking look mature. We’ve got specific levels and targets in view, and we’re following the price action and the wave structure closely — that’s all in the issue. And, with Scotland being out of the World Cup, go Three Lions! (Sorry, can we record that again, please?)
Want Murray’s full analysis? It’s in the July Global Rates & Money Flows, part of Global Market Perspective. Get it today at elliottwave.com.