What happens when speculative investing reaches historic extremes? This excerpt from the June Elliott Wave Theorist examines a ratio that has climbed well beyond its dot-com peak.

Two years ago, The Elliott Wave Theorist showed a measure of speculative vs. conservative investing using the ratio of the NASDAQ 100 stock index to the Dow Jones Utility Average. We thought the ratio was high at 23x. Now it’s at 27x.
It would be easy to dismiss this ratio as outmoded. After all, AI is the big thing, so who cares about utilities? But that is exactly the point. People thought essentially the same thing in March 2000, when the ratio was at 15. Nine years later, it was at 3.
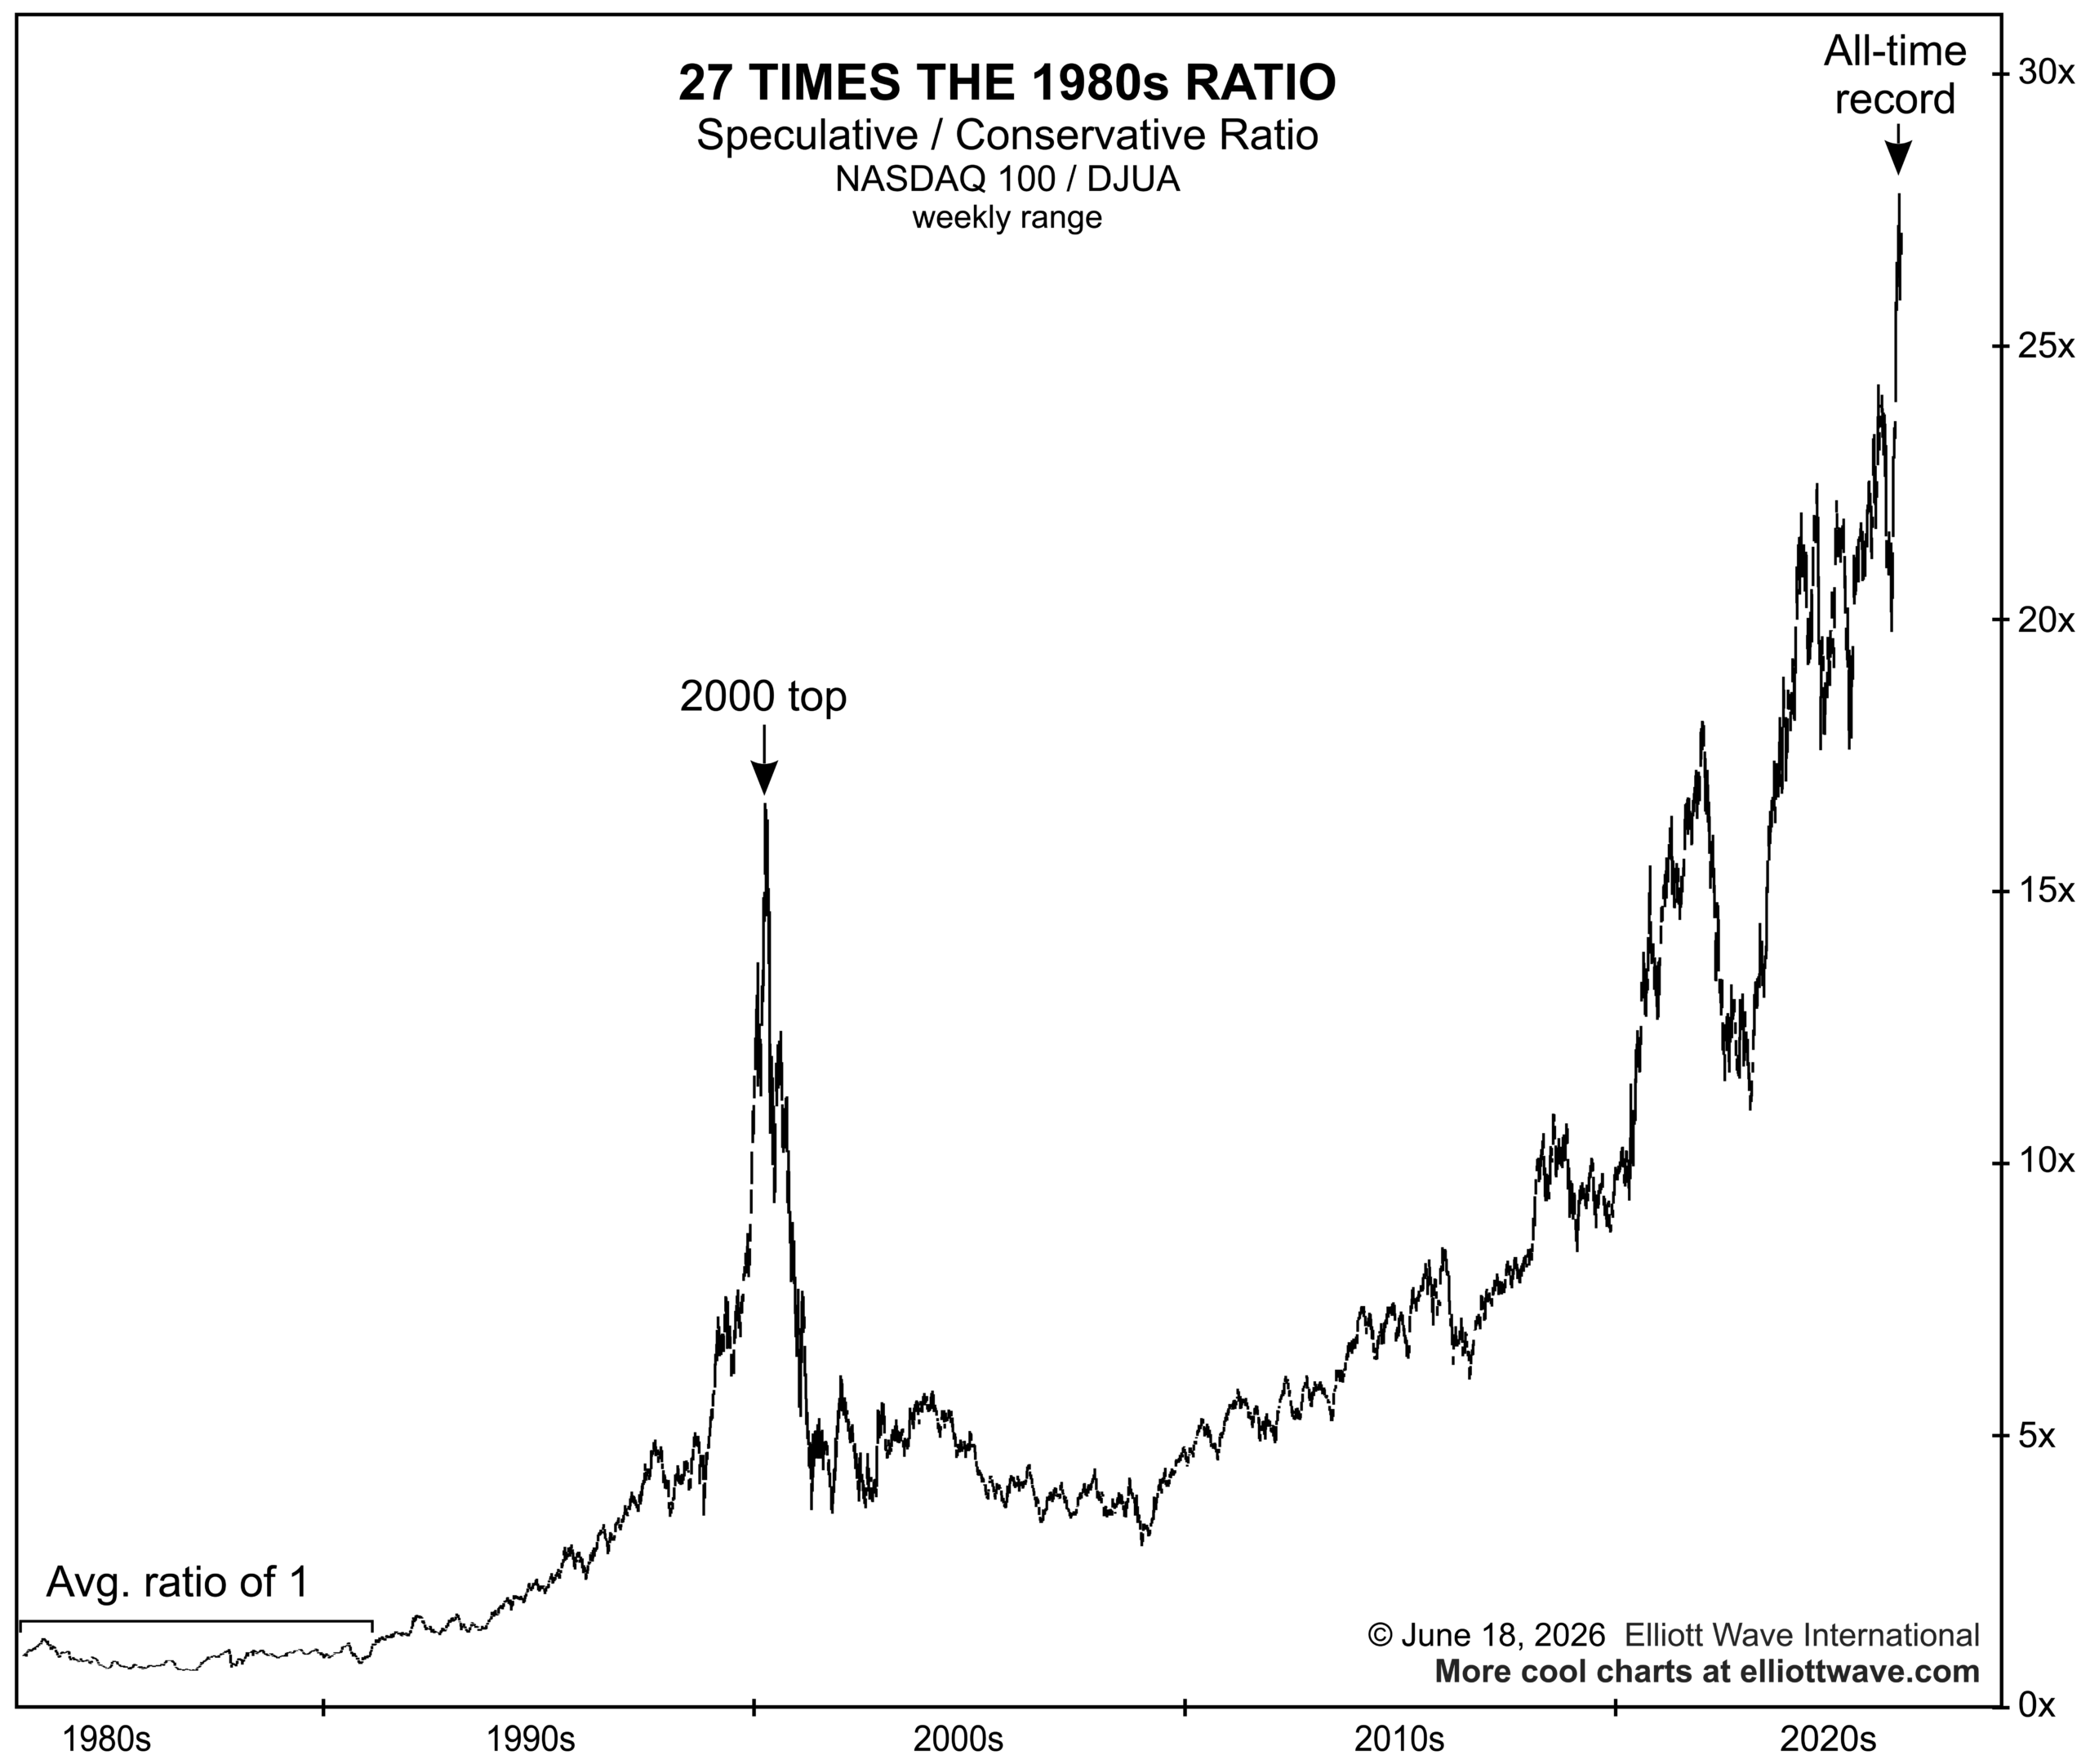
Figure 4 shows that the current ratio is nearly twice the level of the March 2000 peak. When it turns down, the decline should be no less dramatic than it was from 2000 to 2009 as investors shifted from mania-chasing to conservative investing.
This is just one of many signals our analysts are tracking.
Subscribe to our flagship services to stay on top of these developments and more.
Or, buy the latest issue for the full analysis.
Not ready to subscribe? See 18 more red flags inside our newly updated must-read report.