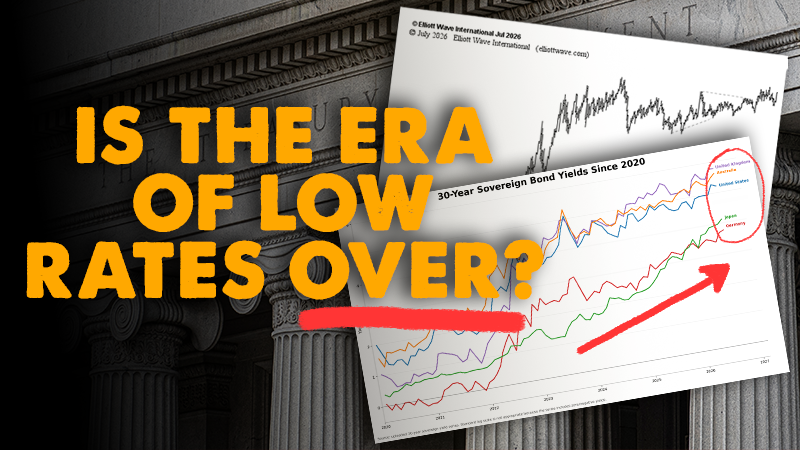
With long-term interest rates back in the headlines, it’s worth revisiting what EWAVES was saying before the latest surge began.
The story actually starts before EWAVES turned bearish on Treasury bonds.
First, EWAVES was bullish
The last time EWAVES was bullish on bonds was June 3, 2024. The Elliott wave pattern indicated that bonds were beginning a significant upward move. EWAVES expected that rally to continue and exceed the preceding high.
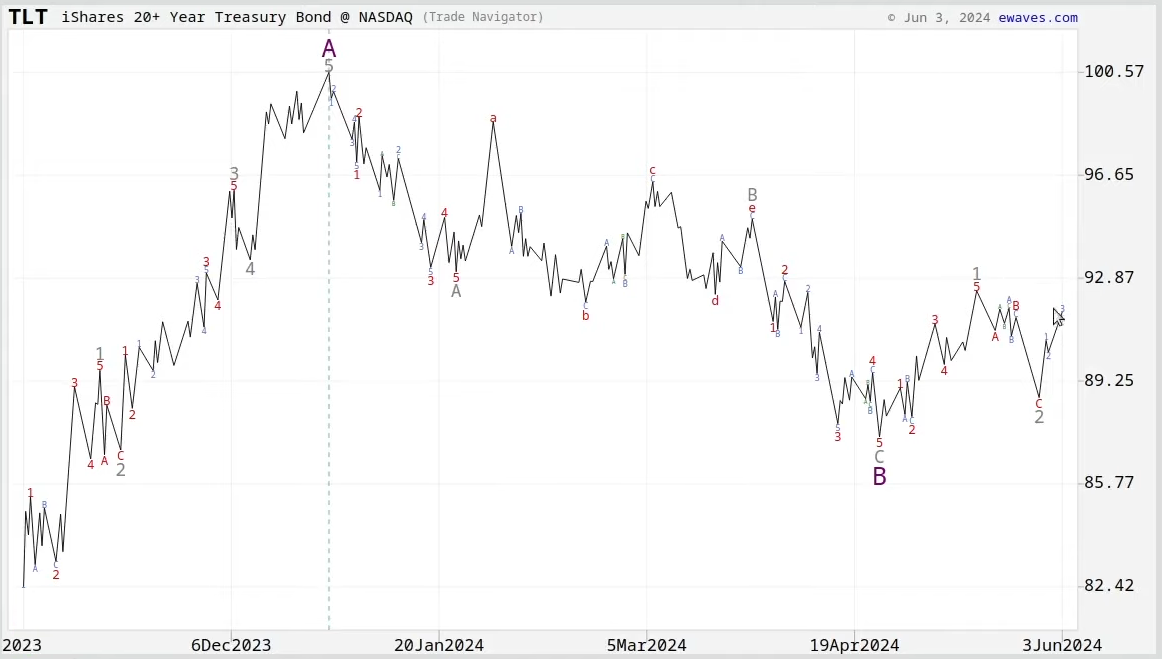
But EWAVES knew—in advance—that the rally would mark the end of a large correction, not the beginning of a new bull market in bonds.
Then, EWAVES turned bearish
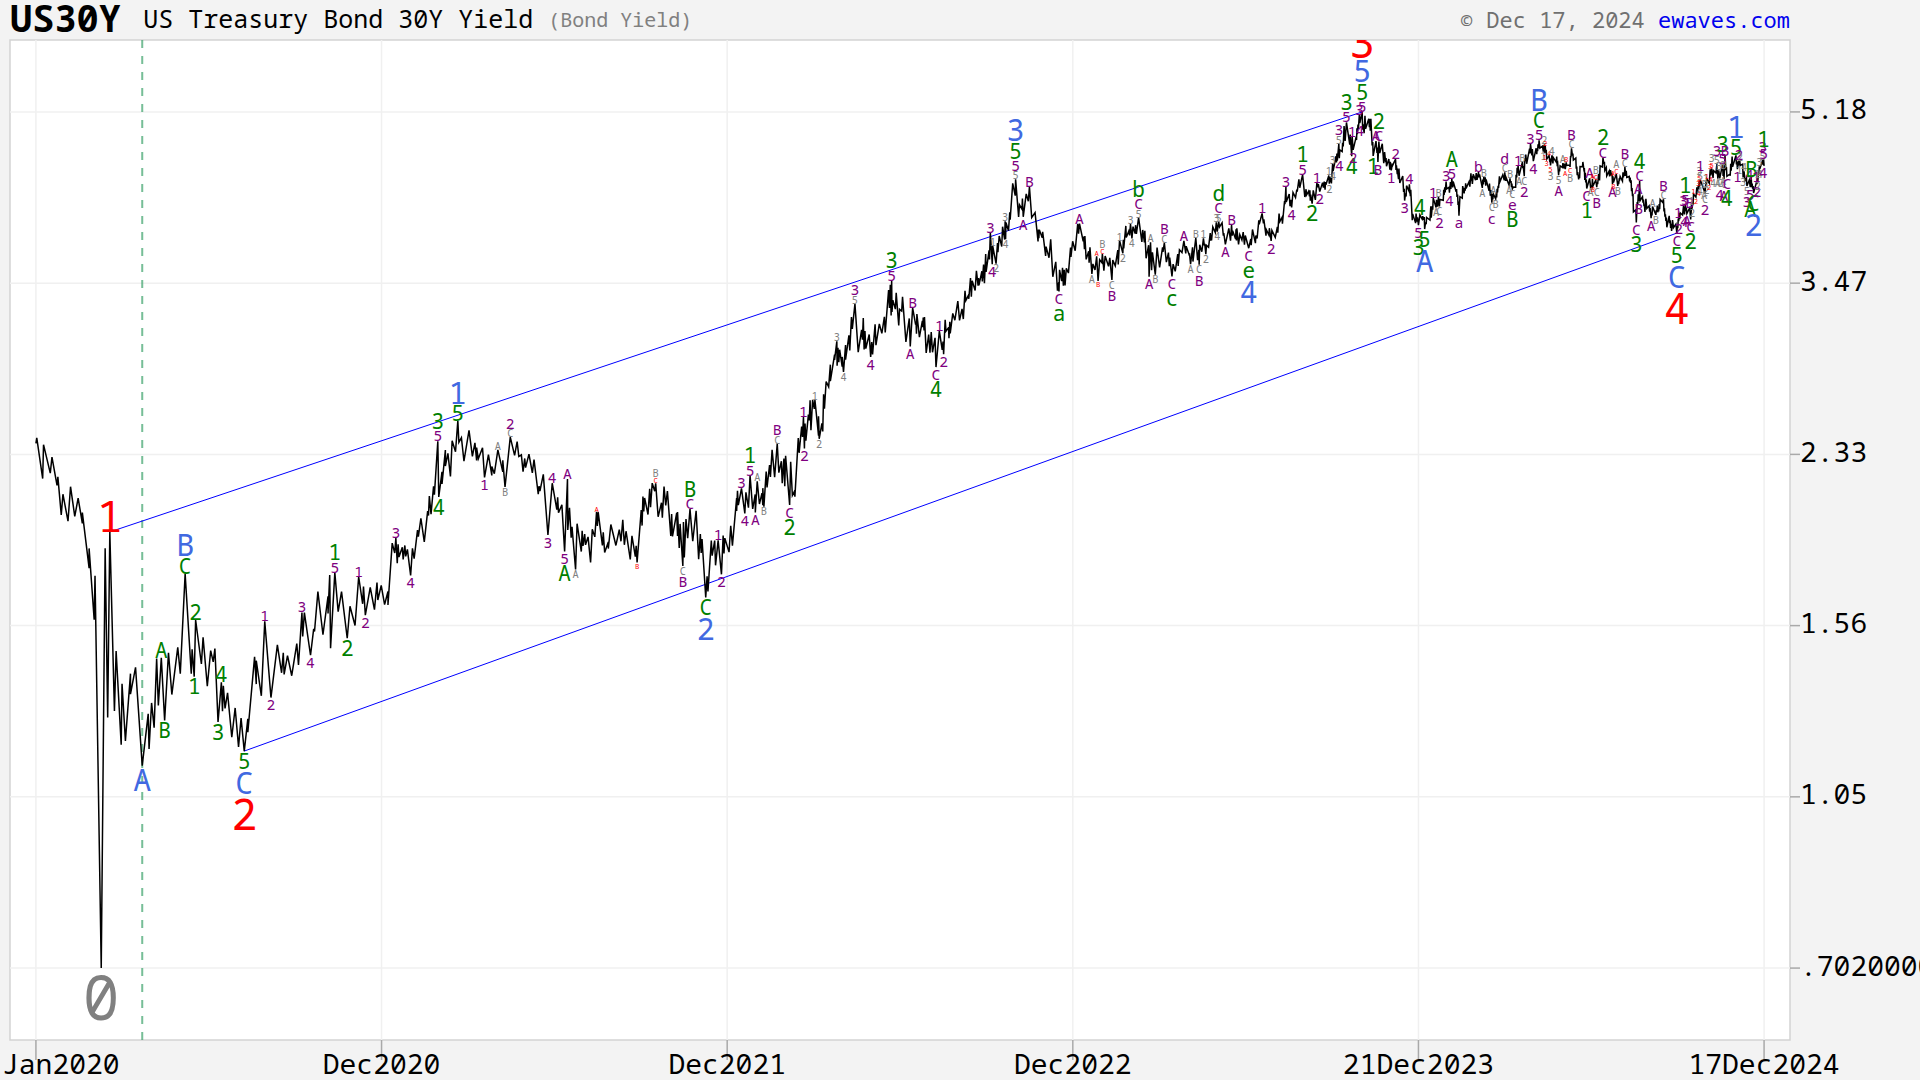
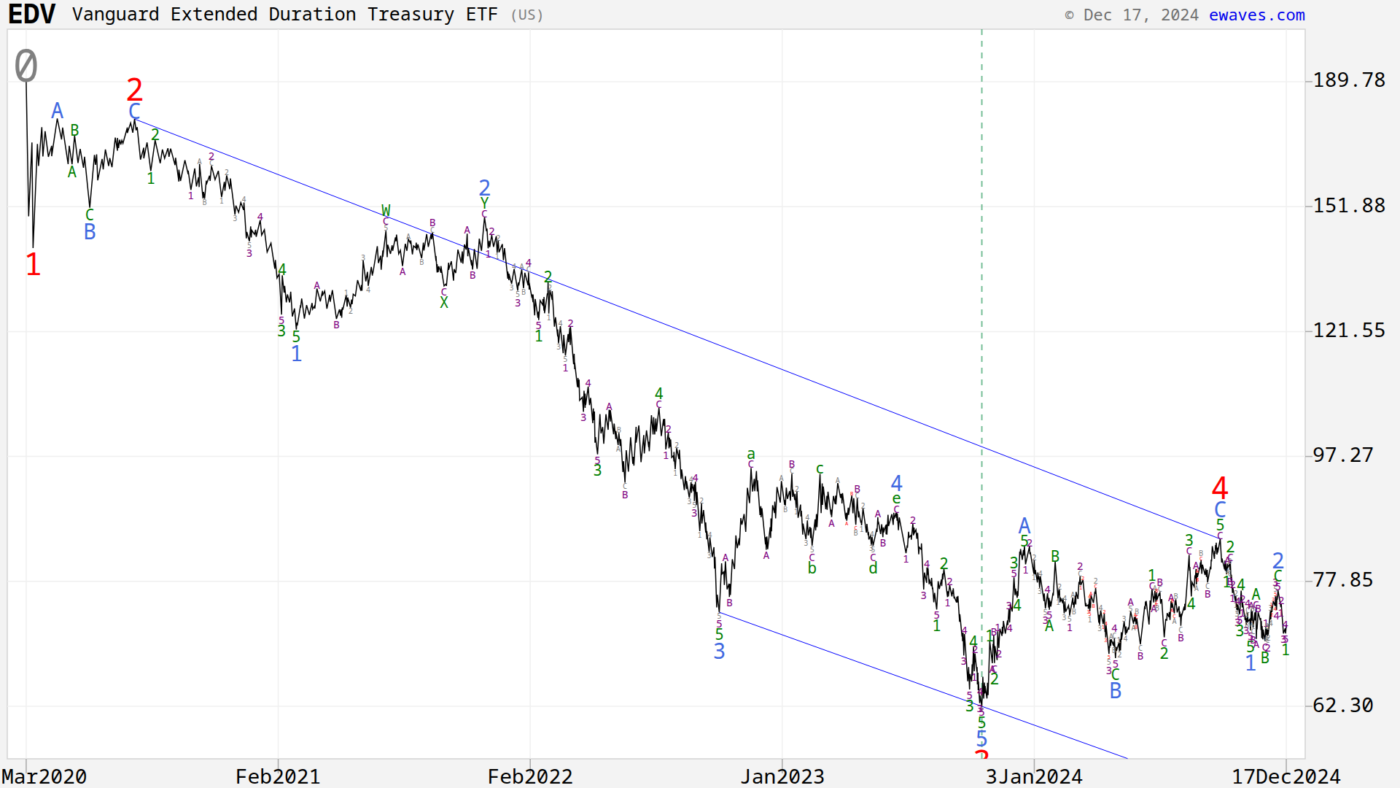
The following two EWAVES charts were published on December 17, 2024. One shows the 30-Year Treasury yield, and the other shows EDV, an ETF holding zero-coupon Treasuries.
Both charts indicated that the counter-trend bond rally had run its course, and that a fifth wave toward higher yields, and lower bond prices, had begun.
See the analysis behind the forecast
In the video below, Elliott Prechter explains how EWAVES arrived at that outlook, including an Elliott wave clue that helped identify the earlier bond rally as corrective, and an interesting parallel between the bond bear market and the stock market crash of 2008.
Watch beginning at 32:27.
What about rates now?
Will long-term rates keep rising, or could a major bond rally eventually unfold?
EWAVES Live subscribers can see our current outlook. The US package includes U.S. bonds and interest rates.