One of the stock market’s important warning signs is getting louder. Junk bond spreads and equities usually move together. When they don’t, it’s worth paying attention. Check out this excerpt from our August 19 Short Term Update.

“[This chart] shows updated prices for both the S&P 500 and the Bloomberg CCC-rated junk bond yield spread, which is inverted … so that it aligns with stock prices. So, a declining line on the chart showing junk bond spreads means that spreads are widening, indicating increasing investor angst. Most of the time, junk bond spreads trend and reverse with equities. When the trends between the two sectors diverge, it is meaningful. …
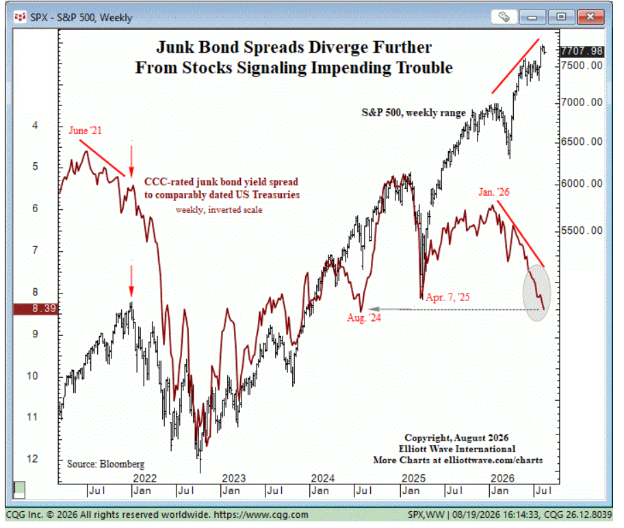
At the left side of the chart, junk bond spreads made a low in late June 2021 and started to widen thereafter, signaling coming trouble for stocks. Five months later the Nasdaq 100 index topped in November 2021 and started a 38% decline to October 2022. Seven months after junk spreads started to widen, the S&P topped in early January 2022 and subsequently declined 28% to October 2022.
After the April 7, 2025 market low, junk bond spreads narrowed until late January of this year. … An aggressive widening trend has been underway since then, with spreads now at the same level as they were two years ago, in August 2024. …
This is just one of many signals our analysts are tracking.
Subscribe to our flagship services to stay on top of these developments and more.
Not ready to subscribe? See 18 more flashing red signals inside our newly updated must-read report.