One strength of Elliott wave analysis is its ability to reveal key turning points — before the crowd catches on.
India’s Sensex in 2008 is a textbook case.
During the Great Financial Crisis, EWI Senior Analyst Mark Galasiewski identified a wave pattern that pointed to a major rally ahead — even as sentiment was deeply bearish.
Check out this excerpt from the November 2008 issue of Global Market Perspective:
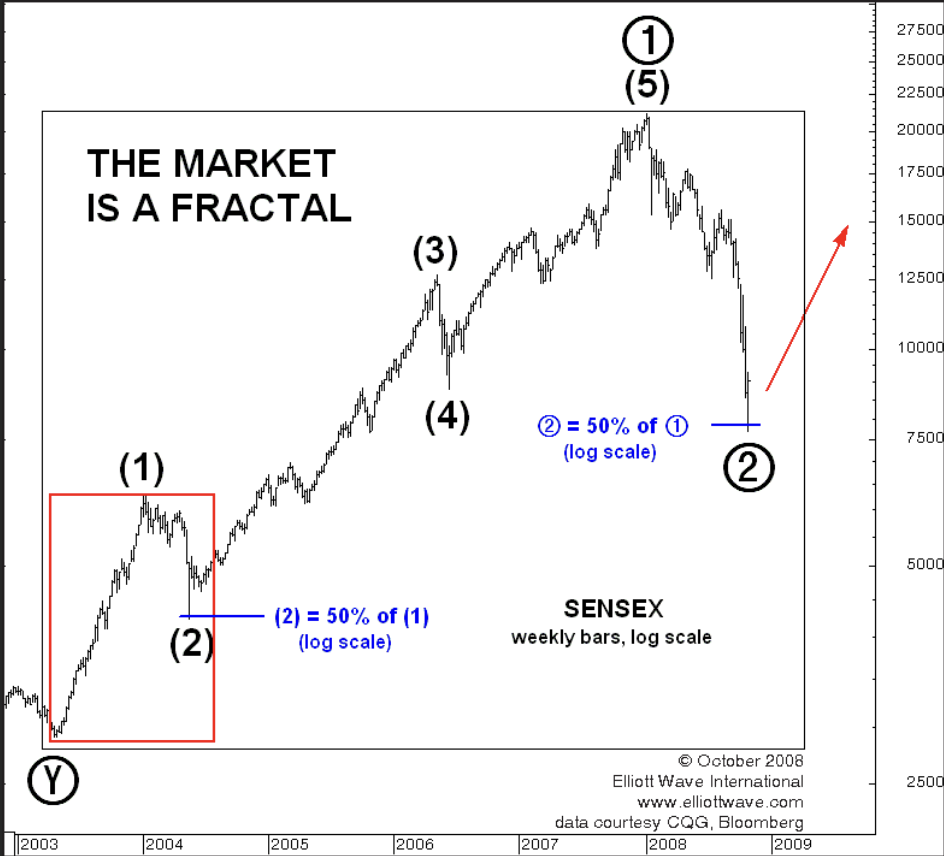
“Notice how the up-down sequence labeled Intermediate waves (1) and (2) (in the small red box) is a microcosm of the larger up-down sequence from the 2003 low to the present (i.e., waves 1 and 2, in the large black box). In both cases, the wave-two correction retraced approximately 50% of the wave-one advance.
If we have identified this ‘nested fractal’ relationship correctly, it means that Indian stocks are about to begin Primary wave 3 of the bull market that began in 2003.”
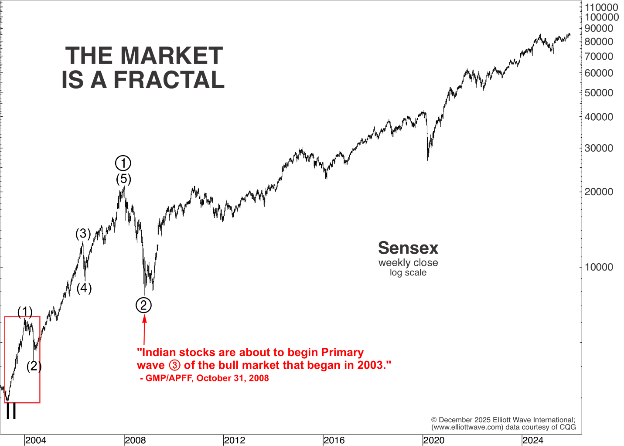
What Happened Next: The Sensex rallied almost nine-fold to its 2025 high.
Why bring up this call? Because alerting you to potential opportunities is what we do. Imagine what acting on it could have meant to your portfolio.
Are you reading us NOW?
See which markets are poised to soar or plunge next – subscribe to Global Market Perspective today.