Vadim Pokhlebkin, head of EWI’s Flash Services, on finding setups with EWAVES and Wave Finder — and only pulling the trigger when Dick Diamond’s indicator arsenal agrees.
Let’s start at the top. What are EWI’s Flash Services, and what’s your role?
I’m the head of Flash Services — we run three of them: one for stocks, one for ETFs, and one for futures. The job’s pretty simple to describe. Out of thousands of markets, I’m hunting for the handful of setups that are actually worth acting on, and then I send subscribers an alert — an up alert or a down alert — saying a move looks like it’s getting underway. From there we manage it with a cancel-alert level, and as long as the market keeps going our way, we just keep nudging that level along and ride it for as long as it lets us.
And the tool doing the hunting is EWAVES. What is it?
EWAVES is the proprietary software that’s the backbone of everything we do in Flash. It’s an Elliott wave engine — it labels price charts according to the Elliott Wave Principle and flags the pivot points where a real opportunity might be starting. It’s built by Qualitative Analytics, and it works differently from other wave software: instead of leaning on a bunch of rigid numeric rules, it uses scale-invariant pattern recognition, so it reads the shape of a wave the way a human analyst would, on any timeframe. They trained it on a massive database of real historical patterns, so it’s evaluating tendencies no person could ever process in their head.
And here’s the part I really like: it’s not looking at the news, or earnings, or fundamentals — none of that. All EWAVES cares about is the wave pattern itself, which is really just market psychology written right into the price. When I open the main screen, it’s tracking something like 8,000-plus markets globally — Australia, China, India, the UK, the US — across stocks, ETFs, indices, bonds, crypto. It’s a lot to sort through.
That’s a huge universe. How do you get from 8,000 markets to a shortlist?
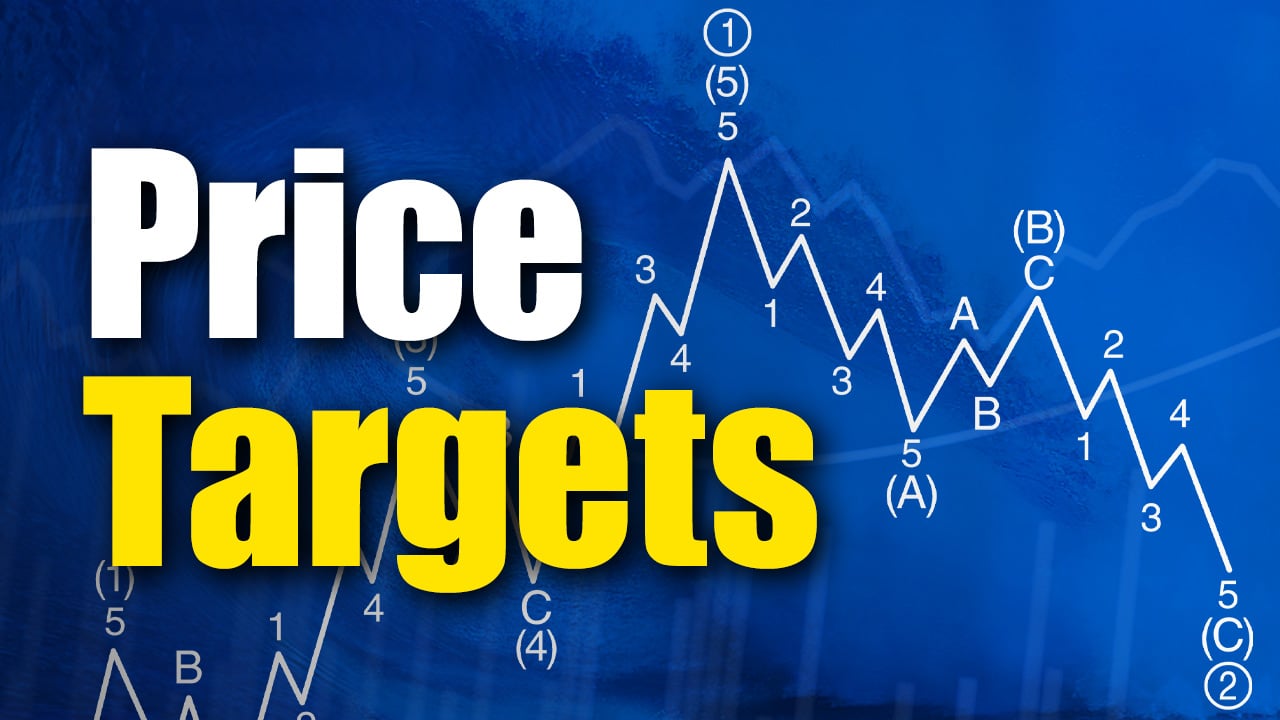
That’s where Wave Finder comes in. It’s a feature inside EWAVES, and the easiest way to think about it is a screening tool — but for Elliott waves. I tell it what kind of setup I want, and it combs the entire EWAVES universe for the matches. You can build your own scan from scratch with some seriously powerful filters or use one of the 11 prebuilt scans. My favorite, hands down, is the Breakout from Correction scan. I’ll narrow the universe to US stocks, like 3,500 names, pick that scan, and in one click I’m down to a few hundred. EWAVES even color-codes the breakout right on the chart and projects a price target. Anything that looks good, I star it and drop it in my favorites folder — usually I’ve got a couple dozen markets parked there that I’m watching for subscribers.
So now you’ve got a clean Elliott list. Is that what you send an alert on?
Not quite! Like the commercial says, “But wait, there’s more!” That Elliott screen gives me an Elliott-wave based opportunity list. Then, I take every one of those names and look at it through the eyes of Dick Diamond.
Tell us about Dick Diamond.
Dick was my mentor. He traded for a living for almost 50 years, and he taught his method for years alongside Elliott Wave International. I took his live course back in 2005, and something just clicked for me. He’s since passed, and for the past decade or so I’ve been the one carrying his method forward — I teach it now through our course, Trade Small, Win Often: The Dick Diamond Method of Trading for a Living. We ran it live seven or eight times; these days it’s available on-demand in the EWI store.
What’s the core of his method?
An extreme aversion to losses, rigorous discipline and Diamond’s famous 80/20 setup. The 80/20 just means Dick figured a trade had about an 80% chance of working out, in his estimation, as long as his indicators were clearly lined up behind it. If not, he didn’t touch it. And his tools were dead simple: three exponential moving averages — a fast one at 21, a medium at 55, a slow at 89, all Fibonacci numbers — plus Williams %R down at the bottom. For a long trade, he wanted those averages stacked in order — 21 over 55 over 89 — price riding above all three, and Williams %R up in what we call the buy zone. Line all that up and you’ve got your 80/20. If it’s only half there, that’s a 60/40, and Dick told us to stay away from those. The man traded off two-minute charts and was in and out sometimes in seconds — the discipline was everything.
So how do EWAVES and the Diamond method actually work together?
Think of it as two filters. EWAVES is filter one — it finds me a beautiful Elliott setup, say a low it’s labeling as the end of a wave two, which means a wave three should follow, and it hands me the level where the wave count is no longer valid. Then comes filter two: I pull that same market up on Dick’s template and ask, are Dick’s indicators pointing the right way? This is where the rubber meets the road. EWAVES might say it’s a wave-two low — and it may very well be — but for Dick it’s not an 80/20 until those moving averages and Williams %R agree. If they don’t line up on the daily, I’ll drop to a 60- or 30-minute chart; a lot of the time the cleaner setup is hiding on the shorter timeframe. If everything agrees, I fire off the alert. If the structure’s gorgeous but the 80/20 isn’t there, I just sit on my hands.
Give us a recent example where it all came together.
Tesla (TSLA). EWAVES labeled the May 19th low at 393.63 as the end of a wave two, so a wave-three rally would be next. On the daily, Dick’s template wasn’t quite there — the 55 hadn’t crossed and Williams %R was lagging — but when I dropped to the 60-minute chart, there it was: 21 over 55 over 89, TSLA price above all three, Williams %R sitting in the buy zone. That’s the 80/20. So we featured Tesla in our Stocks Flash service, opened an up alert around 403, kept ratcheting the cancel level up, and it pushed toward 430 from there. A couple weeks earlier the same playbook worked on Revvity (RVTY) — EWAVES flagged the low, we alerted around $85.60, and it ran to about $100 in a few trading days. Roughly a 16% move before a dip closed us out.
Nice move! So, is it legitimate to use the 60-minute chart if the daily doesn’t work? That sounds like a fair amount of leeway for a rigorous discipline.
Good question. It all depends on one’s time frame. As I mentioned earlier, Diamond traded on 2-minute charts. Meaning each price bar indicated a 2-minute interval. In Flash, our alerts stay active usually between one and two weeks. So, looking for opportunities on a 30- or 60-minute chart is perfectly fine. When you look at a 30-minute chart and look at 13 bars, that’s a full trading day. When you look at a 60-minute chart, it only takes six bars to fill an entire day. So, if the daily chart, for example, does not present an 80/20 setup, then I would drop to a 60 or 30-minute chart. If that shows an 80/20 – then that fits the Flash alert style pretty well. It also speaks to the nature of Elliott waves; they are fractal — meaning smaller Elliott wave patterns make up larger ones. So both the wave patterns and Diamond’s indicators are operating on all timeframes, all the time – that gives us a LOT of opportunities in both directions.
OK, how about a time the two tools weren’t in synch?
Then you sit on your hands and wait — or look somewhere else! It happens all the time —take Allegion (ALLE). EWAVES labeled a wave-two low on May 20th at 125.01, textbook stuff, and after a wave two you expect a wave three higher. But Dick’s template wasn’t ready to pull the trigger. On the daily, all three moving averages were still pointing down. I dropped to a shorter time-frame and it looked more promising, but the medium and slow averages still hadn’t made their crossover — there was no daylight between them yet. So even though EWAVES was right about that low, in Dick’s terms it wasn’t an 80/20. It needed to prove itself a little more. So I waited. That’s my discipline.
Last thing — for someone who wants to do what you do?
Hey, they can! Find the structure first, then filter the entry with Diamond’s refining tools. The software finds you the opportunity; Diamond layers on the 80/20.
Flash Services — Get Vadim’s alerts across stocks, ETFs, and futures.
EWAVES & Wave Finder — Get your own license and scan the markets yourself.
The Dick Diamond Method — Learn the 80/20 approach in Trade Small, Win Often.