On April 2, while bearish sentiment was extreme and many expected lower prices, subscribers to Intraday Stocks Pro Services were shown a very different setup in the S&P 500.
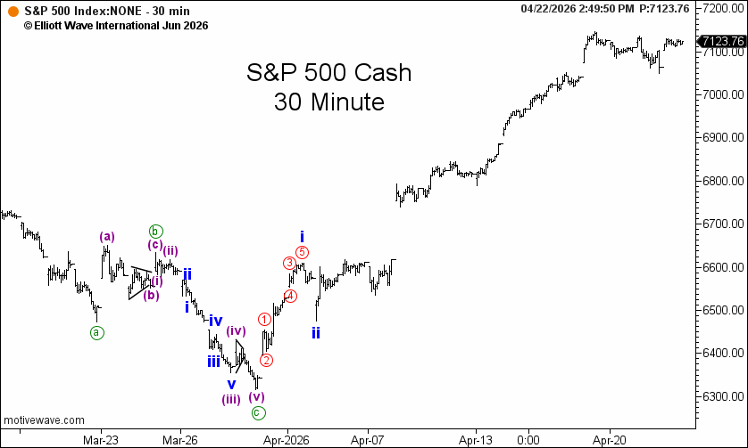
In his 3:35 p.m. intraday update, analyst Robert Kelley posted this chart and wrote:

“The larger count labels today’s low as the bottom of a second wave pullback. That’s due to the clear three-wave drop into today’s low. If this count is right there will be a sizable advance next week. For now prices need to hold above 6501.90, the .786 retracement of wave iii so far, to keep this scenario in preferred status.”
The setup was classic Elliott wave analysis: a completed five-wave advance followed by a corrective three-wave decline — a pattern that often signals the trend is preparing to resume.
And notably, this wasn’t a vague bullish opinion. It came with a clearly defined risk level.
What Happened Next?
The labeled wave ii low held. And prices exploded. From that April 2 low, the S&P 500 surged to 7123.76 — a move of roughly +8.8%, part of what Kelley called “one of the fastest rallies in history.”
This illustrates how Elliott wave analysis can help identify important market turning points before they become obvious in price or headlines.
And it’s the kind of real-time analysis Pro Services subscribers receive every trading day.
Three Ways to Continue
Follow Real-Time Market Analysis
Get ongoing intraday and daily Elliott wave coverage with Intraday Stocks Pro Services.
Follow the Bigger Picture Each Month
Get monthly coverage of U.S. stocks, bonds, sentiment and macro trends with our flagship publications, including The Elliott Wave Financial Forecast and The Elliott Wave Theorist.
Explore Flagship Publications >>
Learn the Wave Principle with Robert Kelley
Want to better understand patterns like this? Study with Robert, and 5 other instructors, in Trader’s Classroom.
Start Learning in Trader’s Classroom >>

Robert Kelley Senior U.S. Equity Analyst & Trader’s Classroom Instructor
Robert Kelley, CEWA, joined EWI in 1990 and edited The Elliott Wave Short Term Update, the Currency and Commodity Hotline and the currency section of The Elliott Wave Currency and Commodity Forecast newsletter. After many years of passionately studying and trading options, he has assembled and taught a multi-part options trading course for EWI. He now produces video lessons for EWI’s popular Trader’s Classroom, an educational service that shows subscribers how to trade with wave analysis and supporting technical methods. He also provides intraday analysis for U.S. stock indexes in EWI’s Pro Services.