You’ve seen those moments on a chart when the price first swings wide, then less so, then even less… until — boom! — the market explodes higher or lower.
Well, you’ve probably just spotted an Elliott wave pattern called a “triangle.”
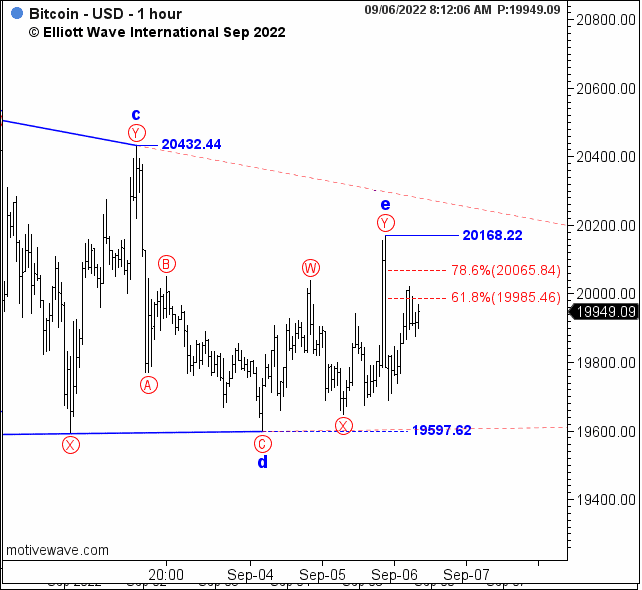
Elliott Wave Principle defines a triangle like this, “A triangle appears to reflect a balance of forces, causing a sideways movement that is usually associated with decreasing volume and volatility. The triangle pattern contains five overlapping waves that subdivide 3-3-3-3-3 and are labeled A-B-C-D-E.”
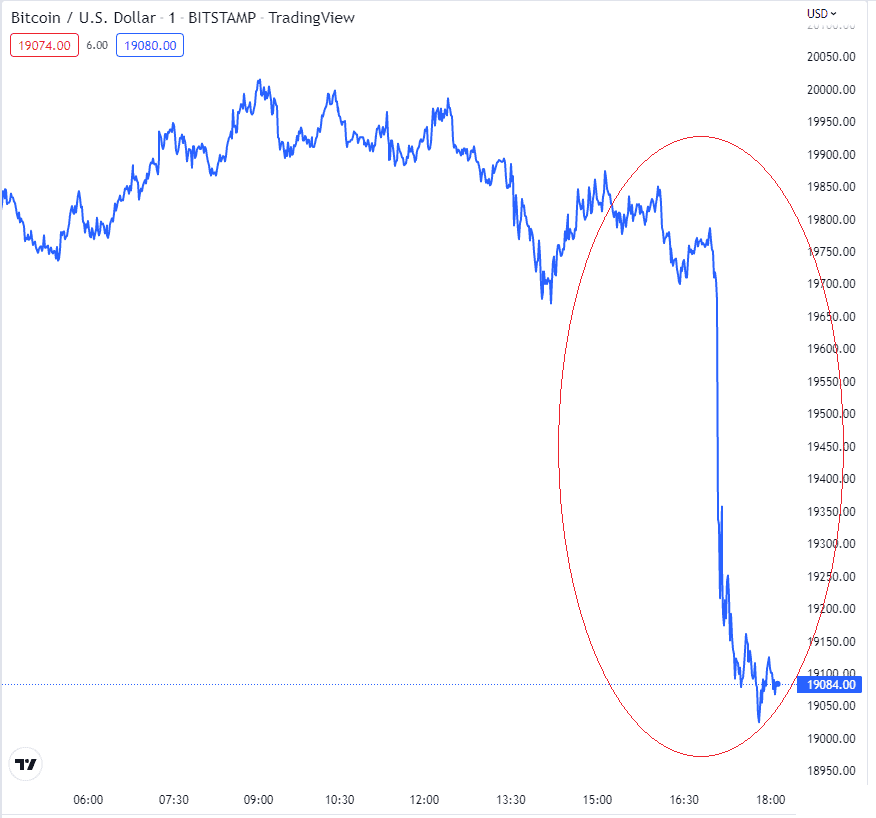
What follows a triangle is where the real opportunity lies. “Elliott used the word ‘thrust‘ in referring to this swift, short motive wave following a triangle.” – EWP
Here’s an example in Bitcoin: