Stock Market Highlights
A Record of Historic Stock Market Calls From Our Flagship Services
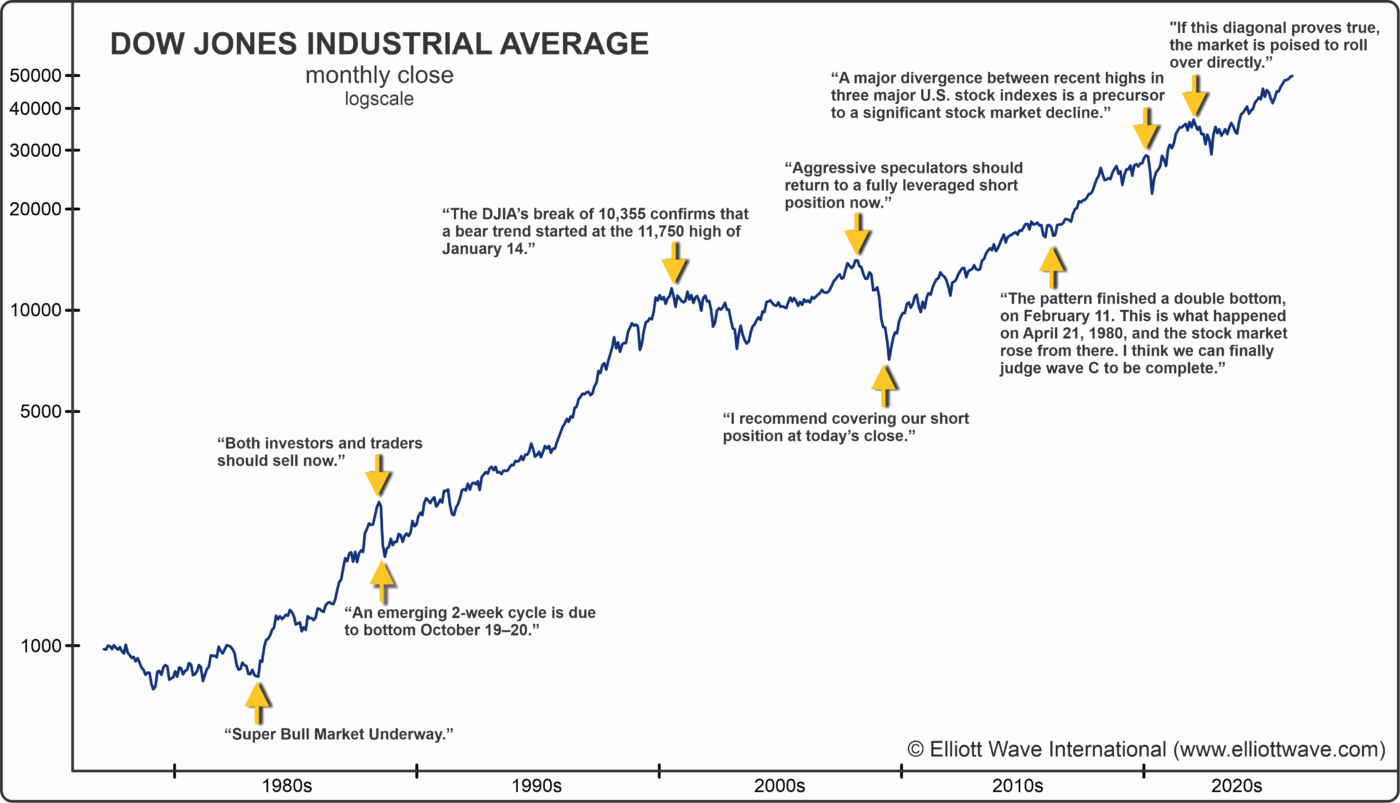
For over 40 years, our analysts have called historic peaks and bottoms in the stock market — often when the crowd was most convinced of the opposite.
This chart shows that you can depend on us to take contrary stances at times when the crowd is extrapolating a trend. Our worst mistakes over these years took the form of being bearish when the market was manic and extended but still had more to go. Every issue shows you the evidence so you can make up your own mind.
Here are the direct excerpts from our publications — real-time forecasts that helped subscribers prepare for the biggest moves before they happened:
1982: “Super Bull Market Underway”
By mid-1982, the stock market had suffered through more than a decade of stagnation. Inflation was still elevated, interest rates were historically high, recession fears were widespread, and investor sentiment was deeply pessimistic. Almost no one was looking for — or even willing to consider — the start of a major new bull market.
This is what we said:

September 13, 1982:
“The orthodox low for the wave count occurred on August 12 at 776.92 on a fifth wave failure, a rare and bullish occurrence.”
“No bear market rally I know of has had such good advance-decline figures.”
“Some incredibly large wave patterns may have been completed, patterns which have important implications…”
“If the market has indeed changed from ‘neutral’ to ‘up,’ then we have entered the first ‘buy and hold’ market since 1949.”
October 6, 1982:
“Super Bull Market Underway”
“October 6, 1982 will go down as a very important date in stock market history. The action on that date confirmed the beginning of a new bull market for Dow Industrial stocks on August 12.”
“The whole orientation of strategy will now have to change from one of aggressively trading the intermediate swings to purposefully accumulating stocks for a long upward pull.”
“Do not assume it is ‘too late’ to get invested for the long term.”
“The market may have 200 points behind it already, but it’s got a long way to go.”
What Happened Next?
The call — made in real time, amid widespread pessimism — marked the transition into the most powerful bull market in U.S. history.
1987: Black Monday
(The Warning Before the Crash, and the Bottom Window Identified in Advance)
In early October 1987, sentiment was exuberant. Many publications were suddenly predicting “Dow 3000 by year end,” while the market sat just below record highs. Yet beneath the optimism, internal conditions were weakening: breadth was narrowing, momentum was slowing, and the rally from late September was losing force. Almost no one believed a major decline was possible.
This is what we said:
October 5, 1987:
“The stock market is at a crossroads on a short term basis.”
“The case that Primary wave 4 will trace out a drop back to the 2300s remains valid.”
“The upside rate of change… has indicated a slowing of the advance… This is usually a bearish combination.”
“Both investors and traders should sell now.”
Interim Report – October 15, 1987:
“An emerging 2-week cycle is due to bottom October 19–20.”
What Happened Next?
The famous Crash of ’87 unfolded just days later. On Monday, October 19 — Black Monday — the Dow Jones Industrial Average plunged 22.6% in a single session, still the largest one-day percentage decline in its history. The market then bottomed the very next day, Tuesday, October 20 — exactly within the October 19–20 window our Interim Report had identified as “due to bottom.”
2000: The “Dot-Com” Peak
At the height of the technology mania, analysts declared a “new economy.” The Nasdaq’s parabolic surge convinced investors that the boom could not end.
This is what we said:

February 22, 2000:
“The DJIA’s break of 10,355 confirms that a bear trend started at the 11,750 high of January 14… A third wave is underway… Support is 9375–9575… A significant slice through this lower support increases the odds for a crash.”
“The NASDAQ 100… has been wedging higher since the beginning of the year. Prices have been tracing out an ending pattern called a diagonal … Once an ending diagonal finishes, prices usually decline sharply.”
Interim Report – March 1, 2000
“The Dow averages, S&P 500 and New York Composite are now in sync to the downside. The NASDAQ 100 achieved the new high allowed for in our Interim Report but now sits on the cusp of a sharp reversal as the pattern traces out the final subdivisions of its fifth wave. A close beneath 4024 will align this last rising index with the rest of the market and signal the end of the mania.”
What Happened Next?
The Nasdaq topped on March 10, 2000 — within weeks of our warning — and lost 78% over the next 31 months. The S&P 500 and Dow entered a multi-year bear market as the “new paradigm” collapsed.
2007: The Great Financial Crisis
Mainstream economists and policymakers dismissed subprime lending as contained. Markets hit record highs as credit risk ballooned.
This is what we said:
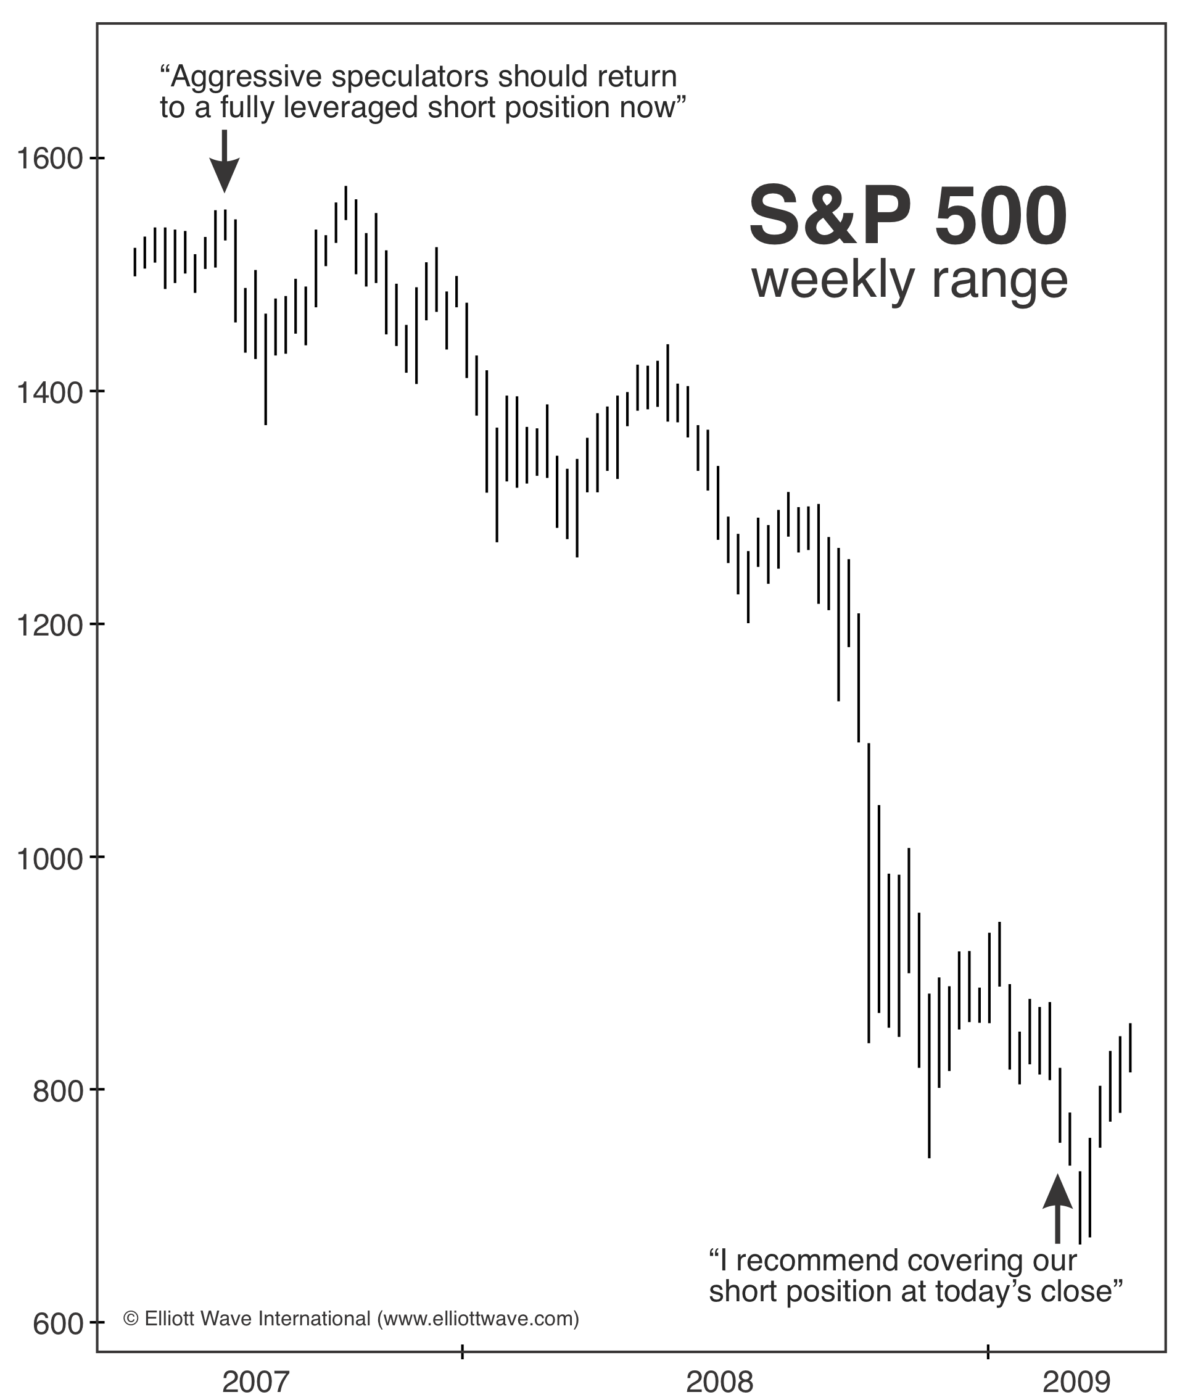
Interim Report – July 17, 2007:
“Aggressive speculators should return to a fully leveraged short position now. We may be early by a couple of weeks, but the market has traced out the minimum expected rise, and that’s enough to act upon.”
August 1, 2007:
“The transition from the Great Asset Mania to the Great Credit Contraction is confirmed by a turn down in the major stock indexes, which started “the great decline” following one more new high in July, as forecast here last month. Sentiment continues to view the credit bust as specific to the subprime area, but it should be global in scope. Near term, a relief rally may well be starting, but it should hold well beneath the July highs and lead to greater selling pressure.”
September 28, 2007:
“The July 17 Interim Report of The Elliott Wave Theorist identified the DJIA’s top tick to the day and advised a return to a fully bearish stance… the entire rally from 2002–2003 should be complete and bear market back underway.”
What happened next:
After a slight new high in the Dow in October (but not in the NYSE or DJ Composite indexes), the U.S. entered the worst financial crisis since the Great Depression.
2009: Calling the Bottom of the Great Recession
In early 2009, fear dominated. Most investors expected another collapse. Sentiment readings hit multi-decade lows.
This is what we said:
February 23, 2009:
“…over the past four months The Elliott Wave Theorist, The Elliott Wave Financial Forecast and the Short Term Update have repeatedly stated, without equivocation, that the market required a fifth wave down. There were no alternate counts. The Wave Principle virtually guaranteed lower lows, and now we have them.“
“If you are a slick trader, perhaps you can finesse the final waves or snag some more profits early tomorrow. But as for our official position, I recommend covering our short position at today’s close.“
March 1, 2009:
“Some measures of market sentiment are achieving pessimistic extremes, so the decline is likely reaching its latter stages… Once five waves are complete within wave (5), the odds will be high that a low is at hand.”
What happened next:
Just days after our reports, the market bottomed on March 9, 2009 — launching one of the most powerful bull markets in history.
In the case of the Great Financial Crisis, our subscribers weren’t reacting to extremes — they were prepared for them.

2016: Calling the Next Advance
Stocks were sliding hard into early 2016. The Dow was retesting its August 2015 lows, volatility was elevated, and pessimism had reached levels last seen near the 2009 bottom. Many believed a historic crash was already underway. Here is what we said:
This is what we said:
January 14, 2016:
“In the September 18, 2015 issue, EWT observed that the bear phase that began in May 2015 and accelerated in August was either the start of the biggest crash ever or part of a high-level correction that would lead to a new high…”
“The pattern so far has all the elements of a developing contracting triangle.”
“This decrease in internal intensity during an increase in external (price) movement is more compatible with wave C of a triangle than with a developing crash.”
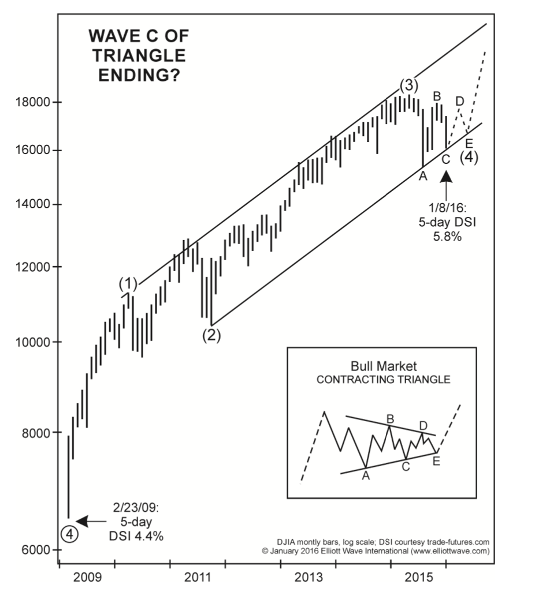
“The critical area for wave C is about 16,000 on the Dow… Today’s low is 16,075.12.”
February 19, 2016:
“WAVE C OF TRIANGLE DONE”
“In line with the usual persistence of C waves, the pattern continued developing, finally finishing a double bottom last week, on February 11. On that day, the Dow registered a new daily closing low for 2016 but not a new intraday low.
“This is what happened on April 21, 1980 with respect to the preceding low of March 27, and the stock market rose from there. I think we can finally judge wave C… to be complete.”
“For the wave (4) labeling to remain viable, the Dow must hold above the low of February 11.”
What Happened Next?
The Dow held above its February 11, 2016 low. Wave (5) followed — carrying the Dow more than 20,000 points higher over the next five-plus years.
2020: The Fastest Bear Market in History
By late 2019 and early 2020, optimism toward stocks had reached euphoric extremes. Major indexes pushed to record highs as headlines declared the bull market “unstoppable,” fueled by Fed rate cuts and trade-deal hopes. Retail speculation surged to manic levels, daily trading hit records, and Gallup’s “Mood of the Nation” showed personal satisfaction at a 40-year high while concern about the economy fell to its lowest level in decades — classic signs of sentiment near a historic extreme.
This is what we said:
October 2019:
“A major divergence between recent highs in three major U.S. stock indexes — the Dow Industrials, the S&P 500 and the NASDAQ Composite — as well as various laggards such as the Dow Jones Transportation Average and the S&P Small Cap 600 Index … is a precursor to a significant stock market decline.”
November 2019:
“A record net-short position in futures contracts by Large Speculators on the CBOE Volatility Index (VIX) suggests that an upcoming spike in volatility will wipe away the calm veneer.”
February 7, 2020:
“The Great Bull Market has become so entrenched that pundits use words such as raging and relentless to describe it (CNBC, January 18). One pundit projected a January rise and then an accompanying rally through the remainder of the year based on historical precedent. With a late January swoon, however, the Dow Jones Industrial Average began the year with a down month. It is a small hint at what we view as strong potential for a bearish surprise in 2020.”

February 21, 2020
“The S&P 500 appears to have completed wave 5 at 3393.52, the high on February 19. The decline to 3328.60, a low this afternoon, may be labeled as five waves. This impulse pattern is wave i of a larger five-wave declining structure. Wave ii will be a snapback rally that will likely last 1-3 days. When complete, the index will start wave iii down. … The other option is that a series of first and second waves have developed since the high, which implies acceleration of the declining trend next week. The recent highs on February 12-19 (Dow and S&P) are now a key level for the bearish case.”
February 24, 2020:
“Various news stories in print and on TV proffered myriad explanations for today’s selloff — Coronavirus, outbreaks in Italy, China’s economic slowdown, outbreaks in South Korea, weak potential for companies doing business in Asia, etc. — but none stand up to reality. All these supposed causes have been well known prior to today. The reason the market accelerated its decline is because it was at the point in the progression of its Elliott wave pattern that indicated a sharp drop.”
What Happened Next?
The Dow peaked February 12 at 29,568 and the S&P 500 followed February 19 at 3393.
In only seven trading days, the S&P fell 16 percent — the fastest drop from an all-time high in history — and in five weeks, major indexes were down more than 35 percent.
2022: Warning of a Trend Change
In late 2021, U.S. stocks were still in strong uptrends and making fresh highs. Investor confidence was elevated, volatility was subdued, and most commentary assumed the bull market would continue uninterrupted into 2022. Here is what we said:
This is what we said:
Interim Report – December 31, 2021:
“The December 23 Interim Bulletin postulated an expanding diagonal in progress for wave 5. It stated:
“This labeling calls for the Dow to pop to one more moderate new high in coming days, probably to a peak below the upper line, and then turn down…”
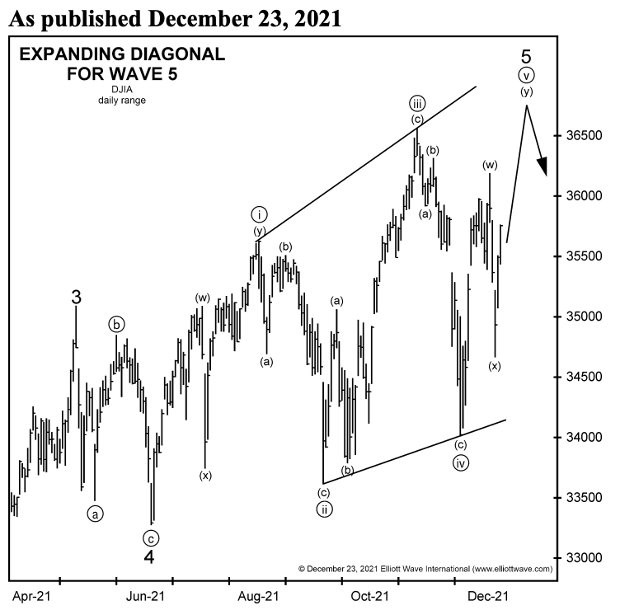
“Diagonals occur at the end of larger sequences. If this diagonal proves true, the market is poised to roll over directly into a bear market.”

January 5, 2022:
“Blue chip indexes appear to have topped in the first three trading days of January 2022. The S&P Composite made a closing high on the first trading day of the year, January 3, and an intraday high on January 4.
The Dow Jones Industrial Average and the NYSE Composite index each made a daily closing high on January 4 and an intraday high on January 5.
The last index to peak was the DJIA, at 12:32 p.m. today, 3.5 trading hours ago.”
What Happened Next?
After January 5, 2022, the Dow declined 22% to its October 2022 low. The S&P 500 fell 25%, and the Nasdaq Composite dropped 36%, marking the 2022 bear market
See What Our Analysts Are Saying Right Now
These weren’t guesses. They were Elliott wave forecasts published in real time — often at the exact turns when the crowd was most certain of the opposite.
Not all our forecasts work out, but we challenge you to find another service this dedicated to getting it right time after time.
Stay ahead of the next major move: Get our Flagship Services >>
Recent testimonials:
- “Great issue! The crowd’s behavior in all socio and financial areas reported wonderfully. And the stunning degree of the excesses has me slackjawed.”
- “The quality of your publications and their content is unparalleled by any of the other publications in existence.” – Nick H.
- “Excellent service with accurate nonbiased opinions.” – Jeff
- “I just wanted to say “THANK YOU.” I have worked for 20+ years saving and investing to build low 7 figure portfolio. The EWI Flagship Publications are the best I have ever seen and will be a subscription that I keep for the rest of my life. So, thank you for providing a wonderful service!” – Brad W.
- “Your insight is incredible and is nothing short of genius.” – Bob C.
- “Sometimes the breadth, depth and elevation of it all goes beyond any words I could find to attempt to describe it — though “epic” comes to mind for both the situation and your work. I am especially fascinated whenever you put the markets into multi-century (or beyond) perspective. Intellectually, it is very satisfying.” – Gary G.
- “It’s amazing! There is so much information that you don’t see anywhere else. And it is the kind of information that can give you a big edge when it comes to knowing what’s going in the markets and what is about to unfold.”
- “Your socio-economic calls have been staggeringly accurate. Do you have people out in the investment community tooting your horn? You should – no one is close to you.”
- “I think your coverage of the underlying technical factors is outstanding.” – Steve B.
See more testimonials >>
Flagship Services
Start Reading Today!
Order by Phone
Mon-Fri, 8am-5pm Et
Contact us at 800-336-1618 or 770-536-0309 (Internationally) and you will get a fast, friendly, knowledgeable person to assist you.
LIVE CHAT
Mon-Fri, 8am-5pm ET
Please use the LIVE CHAT button at the bottom right of your screen to chat with us.
We accept online payments from Visa, MasterCard, American Express, Discover, and Bitcoin through our online store. We also accept payment via PayPal, money order, bank wire, and check (drawn off a U.S. bank). If you would like to pay by any of these methods, please contact our Customer Care Representatives via phone, email, or live chat to place your order.