How to Catch Big Trends EARLY
It’s staggering how much the financial landscape has changed in 30 years. Back then, investors sat at breakfast tables drinking coffee in one hand and licking the thumb of the other to open the Sunday newspaper to the finance section. There, they’d comb through an alphabetical list of stocks in microscopic font so they could begin the process of determining whether their portfolio’s value had gone up or down.
It was in many ways a simpler time.
Today, anyone can install an app on their phone and day-trade while on the treadmill at the gym. And the choices of assets (or asset-ish) things to invest in are seemingly infinite.
Access Helps Investors Be More Successful.
Right?
But the increase in access to information hasn’t led to financial success. A recent University of California study reveals that only 13% of day traders were consistently profitable over a six-month period.
Why? For one thing, many investors are relying on tools and research that tip them off to moves that are almost over — not beginning.
And others, as described in a 2023 UK Financial Conduct Authority paper, are “self-directed” towards “the video content on YouTube, TikTok and Instagram” to make “rapid judgements” about which markets to invest in.
In both cases, investors are left behind the herd.
Here’s How to Get Insights that Enable
You to Catch a Trend Early
Most analysis assumes that current trends will continue.
In contrast, Elliott wave analysis looks at what the next trend will be. It does so by watching investor psychology, and using that data to predict when and how the herd will break.
In doing so, Elliott analysis enables savvy investors to use the herd by getting ahead of it.
It’s not easy. By definition, acting apart from the herd is unnatural. It takes confidence and emotional resilience.
The good news is, you’re not on your own.
Since 1992, our Global Market Perspective subscribers have remained ahead of the herd on landmark trend reversals. They’ve seen that when a market reaches an extreme, it often portends an about-face. At these times, subscribers are poised for a drop or a rally exactly when most investors are expecting the opposite.
History is full of examples. Here’s just one: Think back to stocks finding a major bottom in 2020 at the start of the worst global pandemic in 100 years. Right at the moment when the world was predicting massive declines, the massive rally was seen in advance by Elliott analysis.
In fact, the last 10 years of market history reinforces the point: Trading success doesn’t come from following the mainstream crowd into the markets with the most “likes.”
Rather, as I will show, it comes from seeing the patterns in market psychology that show dramatic change is likely about to happen.
Here are three astounding examples of how Elliott Waves helped prepare investors for reversals in global bonds, commodities, and Bitcoin.
Most Investors Follow the Crowd
Elliott Investors Follow the Patterns
In early 2020, the bellwether Bloomberg Barclays Global Aggregate Bond Index was long into its 10-year bull market. The so-called experts expected the historically low interest rates to continue (of course!) and therefore for prices to continue rising. With no signal that the Fed would reverse its easy-money stance, just about everyone expected bond prices to continue marching higher.
But then, yields began to inch up. It was subtle enough for the mainstream experts to write it off as a blip.
But not the December 2021 Global Market Perspective. Global Market Perspective showed this chart of the Bloomberg Barclays Global Aggregate Index. It warned subscribers that the 2020 bottom marked the completion of five waves down.
The implication was undeniable: A new trend was underway, and prices were going to get hammered. From the December 2021 Global Market Perspective:
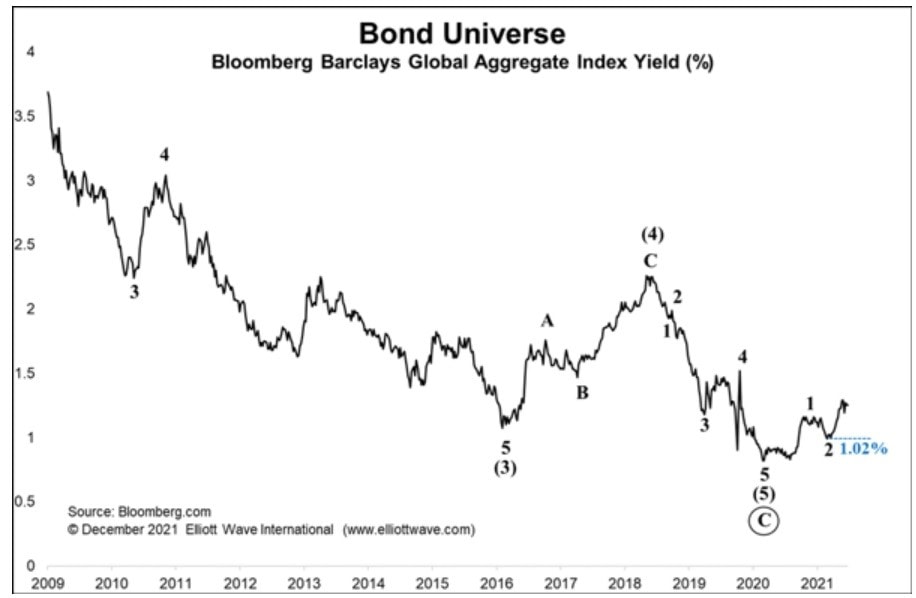
“In terms of Elliott wave analysis, our modus operandi is that the yield on the Bloomberg Barclays Global Aggregate Bond Index is just starting wave 3 higher. If this is correct, we can expect yields across all sectors of bond markets to continue to rise well into 2022 (which, by definition, means prices will fall).”
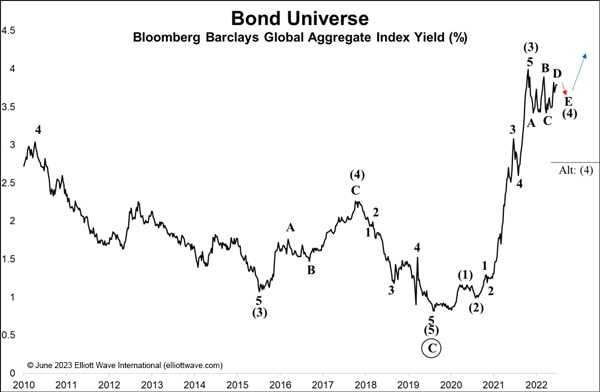
From there, the index’s yield went into a full-out sprint, soaring to multi-decade highs in what would become the first collective bond bear market since the first bank-issued credit card was invented in 1946.
The popular crowd blamed Fed rate hikes for the reversal in yields.
But that was not what happened. Actually, the rise in yields occurred months before the Fed raised rates for the first time on March 17, 2022! Likewise, the UK’s equivalent Bank of England didn’t lift its own rates above .50% until March 2022.
The truth is the market had simply turned. Investor psychology had shifted from accepting lower interest rates to demanding higher ones.
The bull in bonds had no choice but to turn to bear.
Long-time Global Market Perspective subscribers were among a select group of investors well positioned to benefit from the market’s bearish shift.
And, current Global Market Perspective subscribers are equally advantaged to prepare for where the world’s leading bond markets are headed next.
Discover how to get Global Market Perspective on your screen now >>
Know When Written-off Markets Are About to Become
Markets Everyone is Writing About
If ever there was a market with fewer likes and social media cred, it was commodities circa March 2020, the beginning of the Covid-19 pandemic. The sector was slammed on every side by supply bottlenecks to cratering demand.
From The Economist on April 27: “Oil and Commodity Prices Are Where They Were 160 Years Ago…Don’t bother looking for a long-term trend; forecasting commodity prices is a mug’s game.”
But forecasting the long-term trend in commodities was at the center of our February 2020 Global Market Perspective. There, we showed this price chart of the Bloomberg Commodity index, which placed the 2020 decline into a larger historical context.
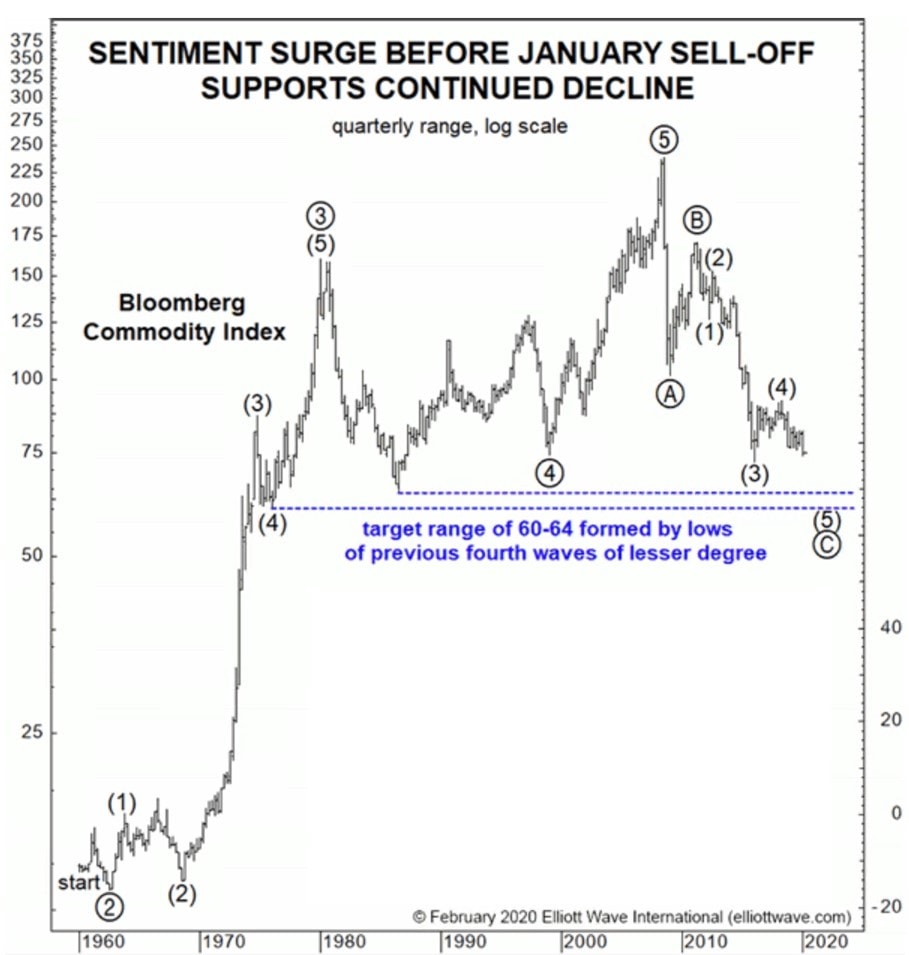
The downtrend was part of a larger bear market that began at the 2008 peak, itself a 3-wave, A-B-C correction of the entire bull market since the 1960s.
Corrections don’t unfold in a vacuum. Their form is governed by the “Guideline of the Depth of Corrective Waves,” which states that fourth waves “tend to register their maximum retracement within the span of travel of the previous fourth wave of one lesser degree, most commonly near the level of its terminus.”
Applied here, our February 2020 Global Market Perspective had a high-confidence endpoint for the developing decline and wrote:
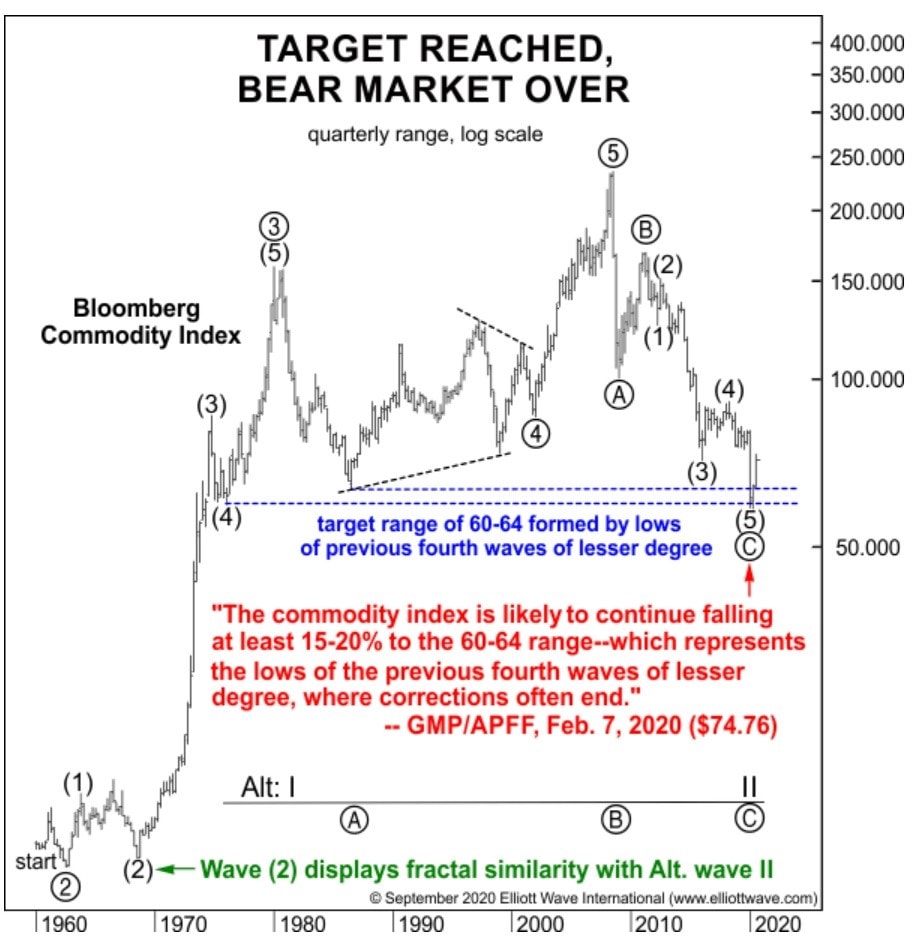
“The commodity index is likely to continue falling at least 15-20% to the 60-64 range—which represents the lows of previous fourth waves of lesser degree, where corrections often end.”
One month later, the March 2020 Global Market Perspective showed that the Bloomberg Commodity Index had fulfilled the “minimum requirements to complete wave (5) of C down.” It wrote:
“If the index were to rally back to their January 2020 highs, we would consider bullish scenarios for the entire commodities complex.”
From there, the index began to show its strength. The September 2020 Global Market Perspective presented this updated chart and confirmed a new bull trend was underway:
“Now that the Bloomberg Commodity Index has completed a three-wave decline from 2008 and then advanced impulsively from its 2020 low, we can say that commodities overall have also ended their secular bear market from 2008.”
What followed upended the mainstream camp that had assumed commodities for dead.
Instead of crashing, a 2-year long bull market ensued that catapulted the sector to historic peaks. Oil went from negative price levels to 14-year highs. Wheat, copper, and natural gas all reached record highs. Food prices spiked across the board. And by June 2022, the Bloomberg Commodity index rallied to its highest level since 2008.
Wall Street influencers thought they had their finger on the non-existent pulse of commodities in 2020, just when the market was about to come alive. Meanwhile, Global Market Perspective subscribers were given advanced warning that this sleeping giant was about to wake.
Once again, current Global Market Perspective subscribers are preparing for what’s next in crude oil and another major energy.
Read the new issue of Global Market Perspective now >>
Elliott Waves: A North Star in the Wild West of Cryptos
Elliott Wave International first started tracking cryptocurrencies in 2009, when Bitcoin had about as much cache as a 2-dollar bill.
In 2011, Bitcoin was still considered a foolish bet, as these headlines from that year recall:
- “Bitcoin: From Success to Flop in Record Time” (June 2011 Associated Press)
- “So That’s the End of Bitcoin… It’s difficult to see what the currency has going for it.” (June 2011 Forbes)
- “Bitcoin is not going to fly because there is no central bank or power base. It’s doomed to fail.” (April 1, 2012 Reuters)
That was our contrarian cue: When sentiment surrounding a market is fully entrenched to one side, it often signals a change in the other direction is forthcoming. Consider this quote from the August 2012 issue of Elliott Wave International’s Elliott Wave Theorist:
“Presuming Bitcoin succeeds as the world’s best currency — and I believe it will — it should rise many more multiples in value over the years.
“Be prepared to ignore the bad news, which will give other investors reasons to justify selling at the bottom.”
What happened next?
After a few years of consolidation, Bitcoin and its digital currency clones went parabolic. Bitcoin went from $15 per coin in 2013 to $20,000 at its height in December 2017 — a gargantuan 133,233% gain.
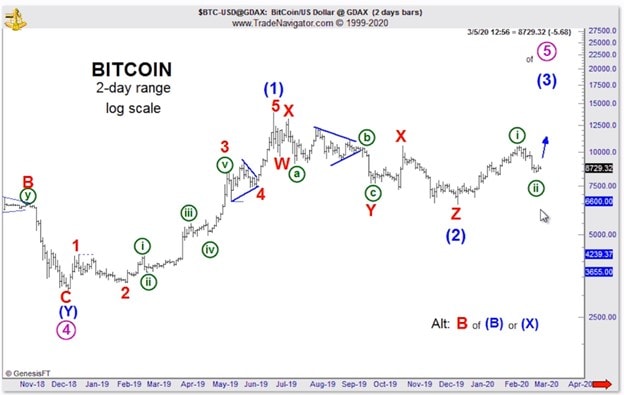
Then, the pendulum swung back. From its December 2017 peak, Bitcoin plunged more than 80% to below $4000 per coin at its 2018 low. Between 2018 to early-2020, a persistent sideways trend prompted the mainstream to lose confidence in Bitcoin’s future.
But our March 2020 Global Market Perspective presented this chart of Bitcoin, which painted a very bullish picture – a third-wave rally.
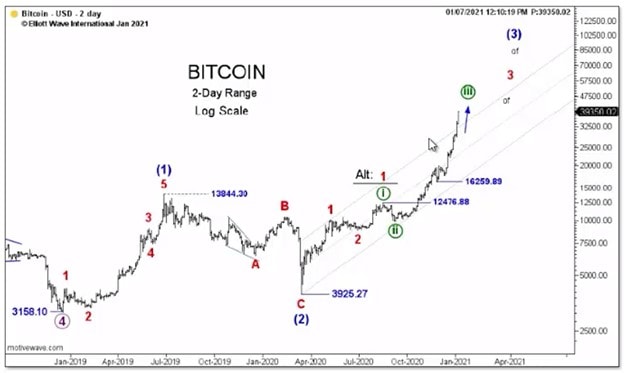
From there, Bitcoin rose like a phoenix from the ashes. The January 2021 Global Market Perspective showed prices more than doubling from current levels and wrote:
“Our bullish theme continues for our cryptocurrencies and suggests it will continue into the new year.”
And that’s exactly what happened. Bitcoin rallied above $68,000 into November 2021.
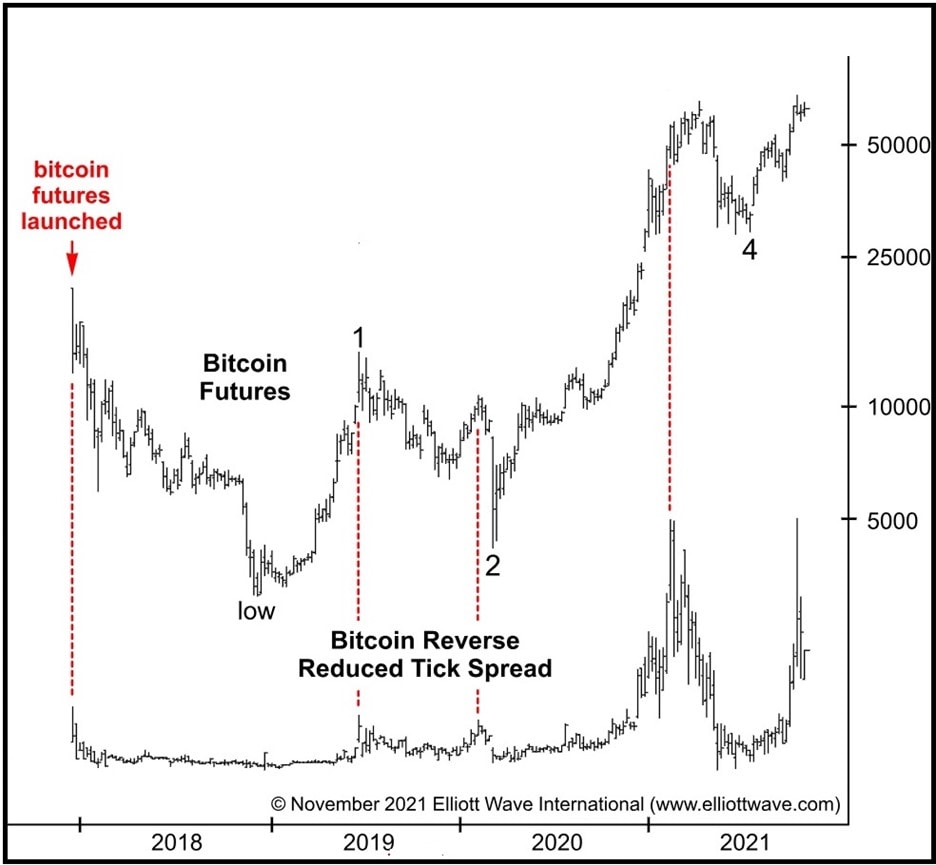
At that point, just as the mainstream experts re-anointed Bitcoin with its crypto crown, Global Market Perspective warned the kingdom was about to fall.
From our November 2021 Global Market Perspective:
“The wave patterns and sentiment considerations in bitcoin may be pointing to [a] top.
“The launch of the first U.S.-traded bitcoin ETFs in October 2021…may again reflect extreme optimism near highs. Sentiment toward bitcoin is again heating up, which should be a concern for investors at this point in their wave patterns.”
As the saying goes: “Once is an accident. Two times is a coincidence. And three times is a pattern.”
For all three sectors – bonds, commodities and Bitcoin – our Global Market Perspective positioned investors in front of life-changing opportunities.
But don’t just take our word for it. Here is a testimonial from a veteran Global Market Perspective subscriber:
“GMP helps me identify opportunities with the greatest probability of success and helps keep me out of positions that may be dangerous.”
Let Global Market Perspective help you anticipate market trends and turns instead of chasing shadows
At the start of each month, GMP gives you clear and actionable analysis and forecasts for 50+ of the world’s major financial markets.
You get insights for U.S., European and Asian-Pacific main stock indexes, precious metals, forex pairs, cryptos (including Bitcoin), global interest rates, energy markets, cultural trends and more.