Wave Riffs

Elliott Wave Insights YOU Can Use

  • Just Like The Book Says!

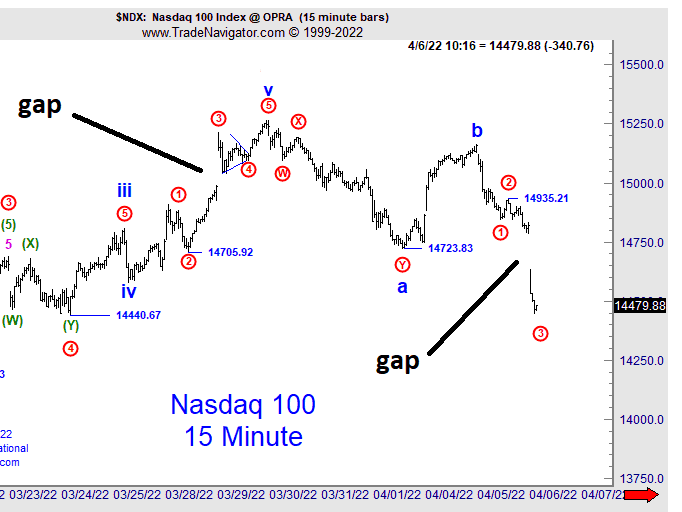
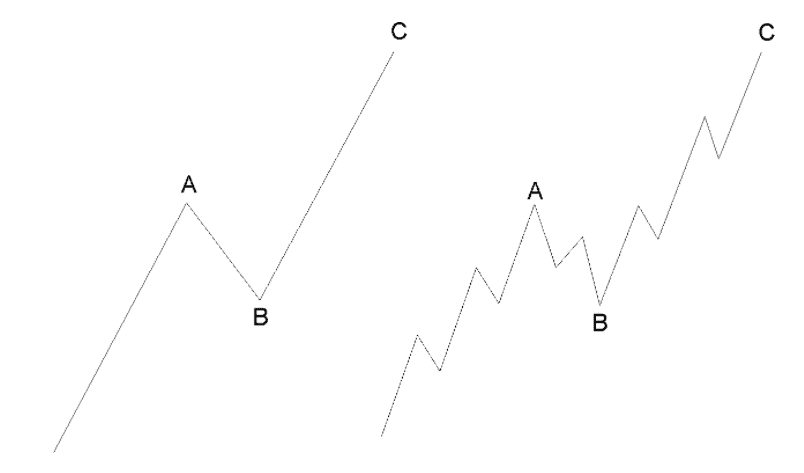
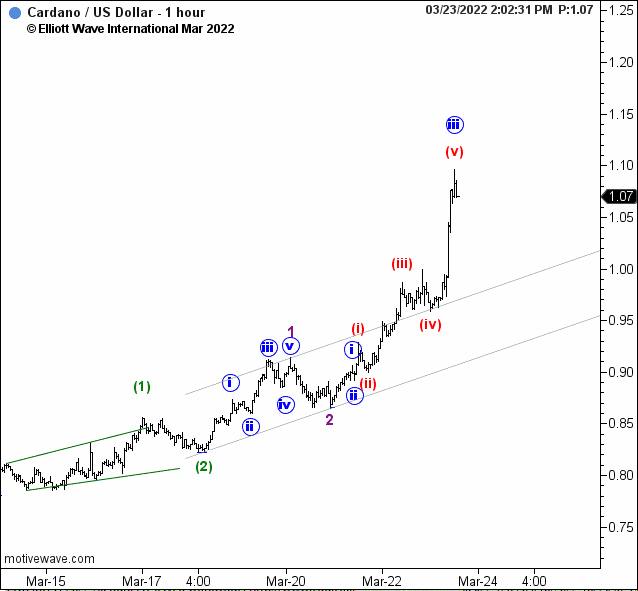
    Elliott Wave Principle says this about the depth of corrective waves: “The primary guideline is that corrections, especially when they themselves are fourth waves, tend to register their maximum retracement within the span of travel of the previous fourth wave of one lesser degree.”

    Now, check out this chart of Costco (COST) – as posted in our Flash Services. See that large grey-ish wave 4 over to the right? Now train your eye back to the left. See the red 3 and the red 4? (How can you not with the convenient lines we’ve added?) That’s the “span of travel of the previous fourth wave of one lesser degree.” Or, as they say in France, voila!!

    And hey, as long as you’re at the store, grab me a few cases of something. I don’t care what; I just love volume discounts!

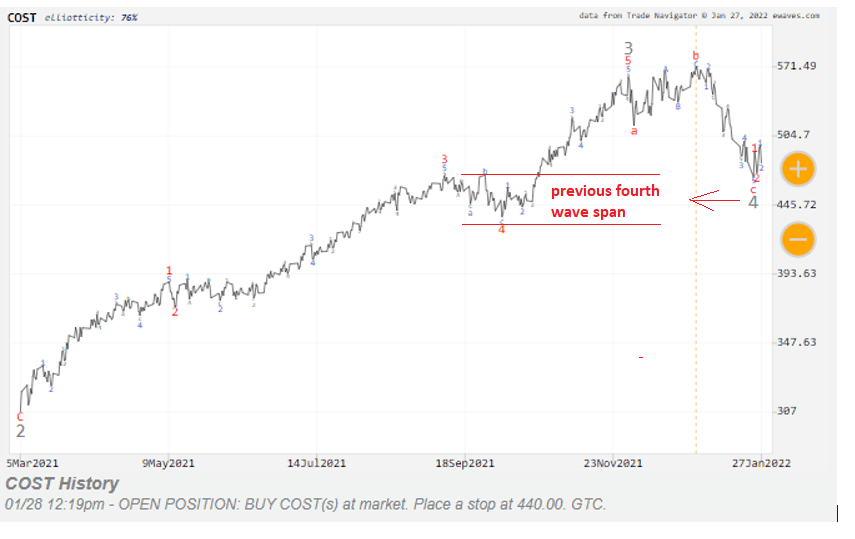
    PS – COST rallied to over $600 by early April. That’s a LOT of paper towels!

    Want to learn more about Elliott Waves? Sure you do – Read Elliott Wave Principle FREE


  • Fall into the GAP!

    Here are two great examples of gaps occurring in one of the three most common places they are found – in the middle of third waves. (Chart courtesy of our U.S. Intraday Stocks Pro Service.)

    Know the other two most likely places that gaps occur? Maybe you need some more education! Read this – FREE: Elliott Wave Principle.


  • Elliott Waves – As Easy as A-B-C!

    We have a tendency as investors/humans to overcomplicate things. Elliott waves are no exception.

    While it takes time to truly master the intricacies of Elliott, you can learn to spot Elliott wave patterns right away. 

    Let’s start with the two basic modes of Elliott waves, impulse (or motive) and corrective waves. Impulse waves go in the direction of the market trend, while corrective waves go in the opposite direction. 

    See. Simple. 

    There are three types of corrective wave patterns: zigzag, flat or a triangle. 

    Today, we’ll zero in on the corrective pattern with a funny name: the zigzag. 

    Here is a description from the benchmark for Elliott waves, Elliott Wave Principle:

    A single zigzag in a bear market is a simple three-wave rising pattern labeled A-B-C.

    And here’s a real-market zigzag example in silver from our March 28 Short Term Update.

    “Silver’s rally from $24.44 on March 16 to $25.89 on March 24 is in three waves. Three waves unfold counter to the next larger-degree of trend, so the “three up” means that silver’s larger trend is down.”

    Your Next Step: Learn how to spot patterns in your charts with FREE access to Elliott Wave Principle.


  • What the heck does a “third-of-a-third-of-a-third” look like??

    Well, we’re glad you asked because we just happen to have a great example right here!

    That’s the way an Elliott wave practitioner describes that part of an impulse wave where the market is simply going vertical. That’s a great thing if you’re on the right side of it and it’s a bad thing if you’re on the wrong side of it. (Trust me on that!)

    Here’s a picture in the Nasdaq from our Pro Services Stocks Intraday Services.

    Update: 3/23/22 1:03pm
    Here’s another timely example of third-of-third waves at multiple degrees. This time in Cardano from our Crypto Pro Service

    03/18/22 12:30 PM ET (Last Price 0.85): Trend remains up from 0.75. Within that context but at rather short term very small wave degree as long as 0.82 nearby structural support remains intact, the existing preferred wave interpretation firmly favors price “going up a whole bunch real fast”, doing so in a robustly third-of-third fashion at four wave degrees of significance.. Said another wave, that’s a bevy of coiling one-two’s poised to be unleashed with rather impressive impulsive buying pressure… if 0.82 structural support earns respect very near term. – Al Graham for Jim Martens

    Chart from 03/23/22 2:07 PM ET:

    Cardano has moved from 85 cents to almost $1.09. Now that’s third-of-a-third action. Every wave trader’s dream.

    Your Next Step: Read how to spot thirds-of-thirds on your charts. It’s all in Section 1.1 of Elliott Wave Principle. And it’s free.


  • Extra! Extra! Read All About It!

    If you want to know if a market is about to turn, you may want to visit your local newsstand. (Is that even a thing anymore?)

    This excerpt from the November 2022 Global Market Perspective shows how big exposure in mainstream media and an ending wave pattern can help you time the turn:

    The U.S. Dollar Index continues to look like it’s topping. The index is testing the level where wave (5) would equal wave (1), a common relationship… Bloomberg Businessweek published a cover highlighting the strong dollar, and Barron’s followed with a similar cover less than two weeks later. The late analyst and EWI friend Paul Macrae Montgomery demonstrated over decades that specialist industry magazines sometimes highlight financial trends on their covers just as those trends are ending. His magazine cover indicator now supports our wave count for the U.S. Dollar Index.

    The dollar traded under 102 two months later.

    Global Market Perspective covers 50+ of the world’s biggest markets — global stocks, bonds, forex, cryptos, gold, oil, investor psychology and more. Click here.


  • Fifty Ways to Leave Your… Realtor?

    Ever been in a bad relationship and couldn’t figure out how to extricate yourself?

    A couple months back, Blackstone limited redemptions for its $69 billion real estate fund. As the December Elliott Wave Theorist described it, “Unfortunately, some investors are discovering they can’t get out.”

    Readers of Last Chance to Conquer the Crash are not surprised and have sidestepped this trap. Here’s what Bob Prechter wrote in Chapter 13, Should You Own Real Estate?

    The worst thing about real estate is its lack of liquidity during a bear market. At least in the stock market, when your shares are down 60% and you realize you’ve made a horrendous mistake, you can swiftly get out (unless you run a mutual fund, pension fund, insurance company or other institution with millions of shares, in which case, you’re stuck). With real estate, you can’t pick up the phone and sell. You need to find a buyer for your house in order to sell it. In a depression, buyers just go away. Mom and Pop move in with the kids, or the kids move in with Mom and Pop. People start living in their offices or moving their offices into their living quarters. Businesses close down. In time, there is a massive glut of real estate. 

    What can you do? Easy! Just make a new plan, Stan – a plan that starts with reading the first two chapters of Last Chance to Conquer the Crash now, for free. It’s not too late to prepare yourself, your family, and your investments for the coming environment.

    Just drop off the key, Lee – and set yourself FREE!


  • There’s No Free Lunch — Moving Average Cross Edition

    One of the simplest technical analysis concepts and indicators to understand and use is the moving average. Basically, it smooths out the noise; at its simplest utility, price above a rising MA is bullish and price below a falling MA is bearish. And of course, you can get fancier.

    One of the most popular methodologies is what is known as a moving average crossover (“cross” for the cool kids), where signals are given as a shorter duration MA moves past a longer duration MA, e.g, if a 5-day MA moves above a 20-day MA, it’s taken as a bullish signal. Again, you can get fancier and there are nuances, but you get the idea.

    And among moving average crossovers, the one known as the Golden Cross, where a 50-day MA crosses above or below the 200-day MA, is, well, the Golden Child of MA crossovers.

    So, this year in stocks, with a Golden Cross having recently taken place to the upside, stock market bulls are encouraged to say the least. And rightly so, the Golden Cross has a decent record.

    I asked one of my oldest technical analysis guys why I too shouldn’t be unabashedly bullish.

    “Ha!” he told me. “One of the very first backtests I ever ran (on my TRS-80 with 16K of memory and a cassette deck back-up) was using a moving average crossover on an hourly chart of the NYSE Composite. Would have been 1978 or so. Sucker KILLED during a rally! Easy street, here I come. Then the market stopped trending and went into a sideways mode. Nothing extreme, just sideways. Whipsaw city. I was the one who got killed. Lesson learned.”

    Bottom line? There ain’t no free lunch — including Golden Cross signals.

    The new February Financial Forecast delves into the Golden Cross and notes several times when following it would simply have made you cross. Read that section now.


  • Elliott Waves and Fibonacci

    If you’ve subscribed to any of our services, taken a class with one of our instructors or even consumed any of our free content, you’ve more than likely come across the relationship between Elliott waves and Fibonacci. EWI’s analysts often use Fibonacci retracements as a point of reference when forecasting a market’s next move. Here’s a very short explanation from Elliott Wave Principle — Key to Market Behavior:

    As we first showed in Figure 1-4, the essential structure of the market generates the complete Fibonacci sequence. The simplest expression of a correction is a straight-line decline. The simplest expression of an impulse is a straight-line advance. A complete cycle is two lines. In the next degree of complexity, the corresponding numbers are 3, 5 and 8. As illustrated in Figure 3-10, this sequence can be taken to infinity. The fact that waves produce the Fibonacci sequence of numbers reveals that man’s collectively expressed emotions are keyed to this mathematical law of nature.

    EWP goes on to explain the relationship in much greater detail — along with The Golden Section and the meaning of Phi — in Section 3. In section 4.1, you’ll see an examination of Fibonacci time sequences and common retracement levels of various Elliott wave patterns. It’s eye-opening stuff, to say the least.

    Read Elliott Wave Principle now, free.


  • I Counted to 5… Now What?

    If you know how to count to five, you can learn to how to spot the most basic Elliott wave pattern.

    After five waves are complete, you can expect a move in the opposite direction.

    Here’s an example of a completed five waves in Ethereum courtesy of Crypto Pro Service.

    Ethereum traded ABOVE $1700 less than 2 days later!

    You can learn all about Elliott wave pattern recognition in our free online eReader of “Elliott Wave Principle: Key to Market Behavior.”


Join Club EWI Today

  • Exclusive services, products, events, pricing and discounts.
  • Access to the Club EWI archive of wave training resources and market reports.
  • Subscription to a special email newsletter featuring the “best of” market coverage, analysis and training.