Category: Video
-
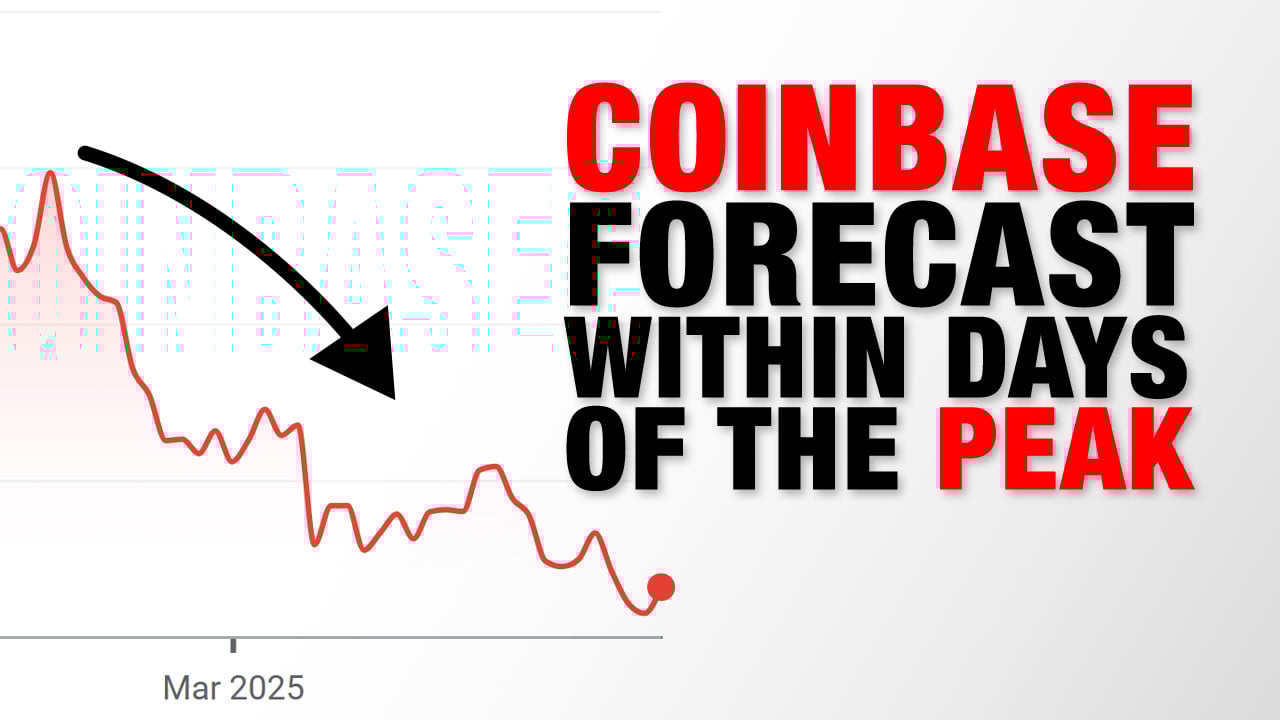
What We Said Before This Crypto Index Fell Fifty Percent
The Coinbase crypto index saw a powerful rally into December 2024. Yet, within days of the price peak, we forecast a reversal at two degrees of trend. See the Elliott pattern for yourself in our brief video.
-
Emerging Markets Up, U.S. Dollar Down
Emerging markets have dramatically outperformed U.S. stocks in 2025 so far. In January, that’s what our Global Market Perspective told subscribers to expect. See the forecast and what may follow the rest of this year.
-
High Market Drama Ahead!
See the high-yield (junk) bond chart that offers a “clue” hiding in plain sight that investor sentiment has changed profoundly..
-
Ballooning Money Supply & Market Breakdowns
Financial news in Europe? It’s not good today and could get worse tomorrow. Hear our analysis in this brief video.
-
Here’s What Happens When Stocks Gain Points But NOT Value
EWI’s Brian Whitmer shows a sensible way to value stocks that’s been hiding in plain sight, even as it screams “caution.” See the charts and data for yourself in this 3-minute video.
-
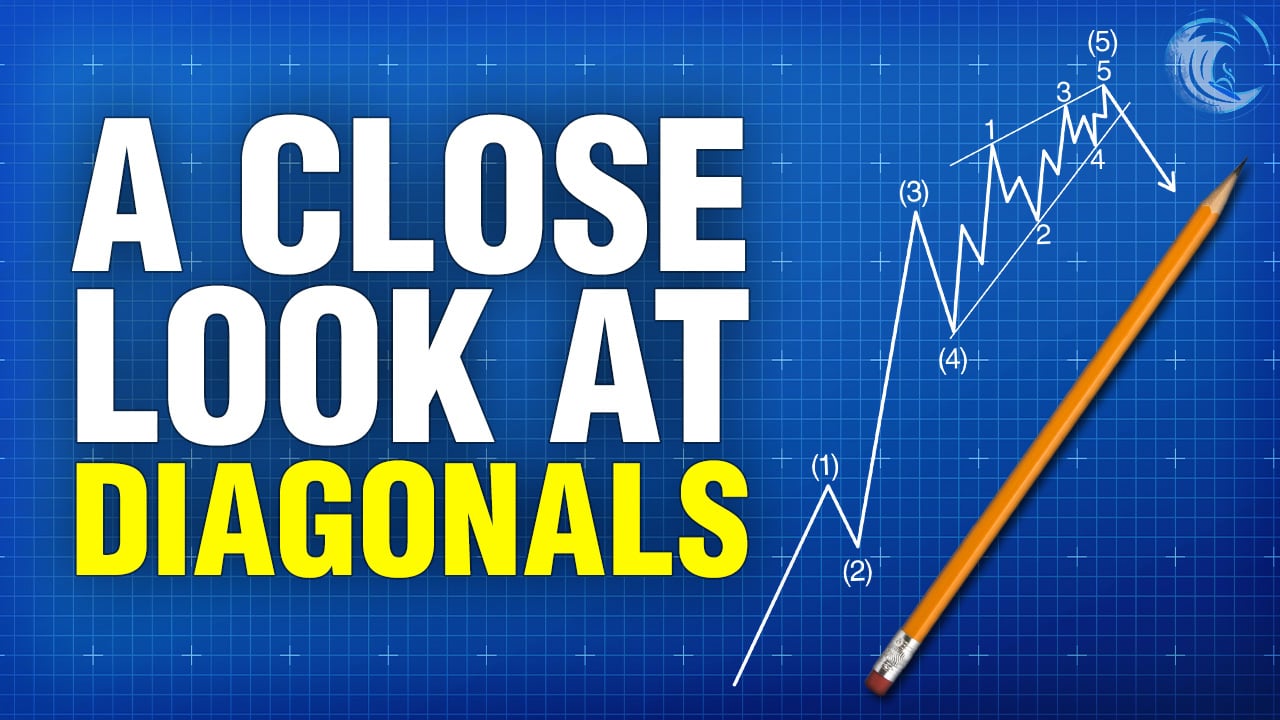
A Close Look at Diagonals
Correctly identifying an ending diagonal in real-time can be one of the most exciting (and rewarding!) market timing experiences you’ll ever have! In this 9-minute video clip taken from the Essential Elliott Wave Trading Workshop, Trader’s Classroom contributor Robert Kelley takes you through the ins and outs of ending (and leading) diagonals.
-
When Hype Itself Becomes A Bubble
Today’s stock market sentiment is loud, clear, and unanimous: Private investors and financial professionals alike are fanatically bullish. What’s more, says EWI’s Brian Whitmer, these market participants all know stocks are overvalued. Get the context you won’t see or hear elsewhere in this fact-filled, 3 minute video.
-
The Pre-Flight Checklist: A Smart Approach to Trading
Successful trading starts with a structured approach. In this video, Parallax instructor Imre shares a Pre-Flight Checklist used to analyze trades with clarity and confidence. See a sample trade and how the Checklist and Elliott waves are used to assess the trend, structure, and momentum.
-
Watch a Clip of Bob Prechter’s NOIC Speech
Check out this 1 min+ excerpt of Robert Prechter’s recent address to the New Orleans Investment Conference. His talk is titled “Trend Changes in Key Markets.”
-
“A Great Golden Age” … or The Greatest “Hindcasting” of All Time?
If you project the current financial market and economy into the future, is that a forecast? Or, have you simply cut & pasted yesterday into tomorrow? The answer is obvious, yet if you’re an investor, that answer really matters. Put it bluntly, now is not the time to assume that good times will keep going.…