Read the Overwhelmingly Bullish Case for Solana (SOL)
Solana just hit $99 today! (12/22/23)
This market continues to surprise most traders.
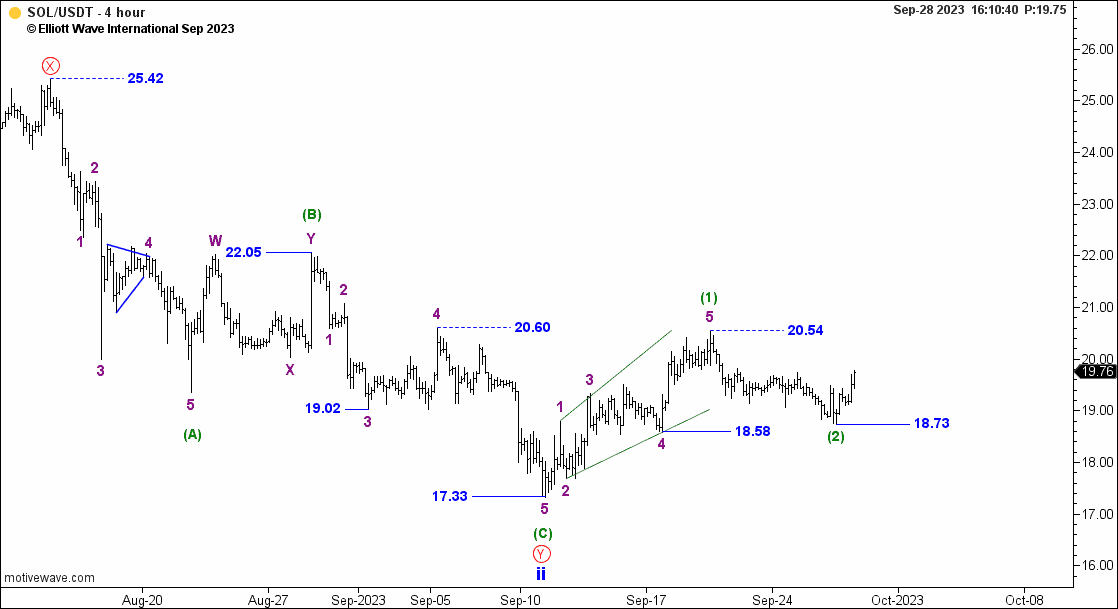
But 79 bucks ago…just before this 395% rally started…EWI’s Pro Services team posted this compelling chart.
If you’re an Elliott wave trader, you can see exactly why this chart is compelling.
But, if you aren’t, let me help you out…
Trend: The market traced out five waves up from the September low. That indicates that the trend is up.
Turn: Wave (2) ended in late September, pennies from the low of the previous 4th wave. Based on Elliott wave guidelines, that’s exactly where Elliott wave traders expect it to end.
Pattern: Wave (3) of iii is about to start! To Elliott wave traders, that indicates a super-charged move is ahead.
All this adds up to an Elliott wave opportunity.
That’s why the Pro Service team said…”
“SOL has advanced a bit further from 18.73, which ideally serves as the wave (2) low [at 17.33]. Breaking above 20.54 decisively would bolster the idea wave (3) is getting underway.”
If you trade cryptos and aren’t using solid Elliott wave analysis, you’re missing out.
Clear Waves = Clear Setups
Right now, the crypto waves are clear — and point to another year filled with opportunity.
Let us help you catch and ride the NEXT BIG wave in cryptos.
I’m an Investor
I need big-picture forecasts for cryptos each month.
Our Global Market Perspective now includes crypto coverage! Each month, Chief Crypto Guide Tony Carrion provides his detailed video analysis of the best crypto opportunities on his radar — including Bitcoin, Litecoin and Ethereum. Plus, you get Elliott wave forecasts for traditional markets like stocks, bonds, metals, currencies and more — more than 40 global markets in total.
I need intensive crypto coverage throughout the day.
Cryptos are one of the most exciting markets on the planet, offering HUGE opportunities. And our guides have a lot of experience forecasting them. In fact, in 2017 we added this asset to our Pro Services intensive (intraday) coverage. Since then, our Crypto Pro Service analysts are on record with multiple calls that helped subscribers catch major moves. Join them now.
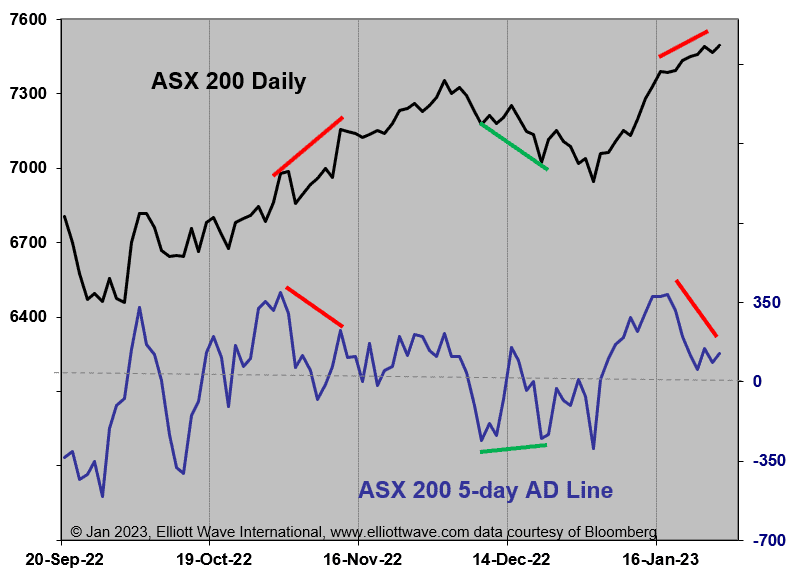
Good poker players learn to read their opponents’ “tells” – subtle signs in their behavior that tip off what cards they REALLY have. Good market technicians learn to do the same with oscillators – subtle signs in their behavior that tip off what the MARKET is getting ready to do.
Here’s a great example from Charles Dow award winner and APSTU editor, Chris Carolan, regarding the ASX 200:
Australia – ASX 200 Index
The ASX 200 is holding on to recent gains while intraday momentum measures and the breadth oscillator are correcting. The ability of overbought indicators to correct themselves while prices move sideways is a hallmark of a strong trend. We remain intermediate-term bullish on the ASX 200. Market timers who attempt to catch short-term pullbacks are likely to find the market runs to the upside and does not give them a re-entry opportunity.
Carolan has been in the markets for nearly 40 years and YOU can read his analysis 3 times a week and get an education too. Click here.
How to Incorporate Seasonal Tendencies Into Trading
Seasonal charts are another subordinate tool I like to use in conjunction at times with the Wave Principle to look for opportunities. Seasonals show us historical price tendencies over many years of data. Some markets/stocks are more seasonal than others. One approach I use is to note key turn dates on the seasonal chart for the upcoming year and record them in a spreadsheet. As the year moves on you have a heads up for potential turning points without having to look at the seasonal charts on a daily basis. If I’m counting a completed wave pattern into one of these date windows, it gives me a perceived added edge to a potential trade. Sometimes those perceived edges work out, and sometimes they don’t!
Watch our Trader’s Classroom instructor Robert Kelley walk you through charts of S&P 500, VIX, VXX, AAPL, EUR/USD and more to show how to make seasonality work for you. Get this full 20-minute lesson now, FREE.
Pssssst! Wanna Sound Like a Pro?
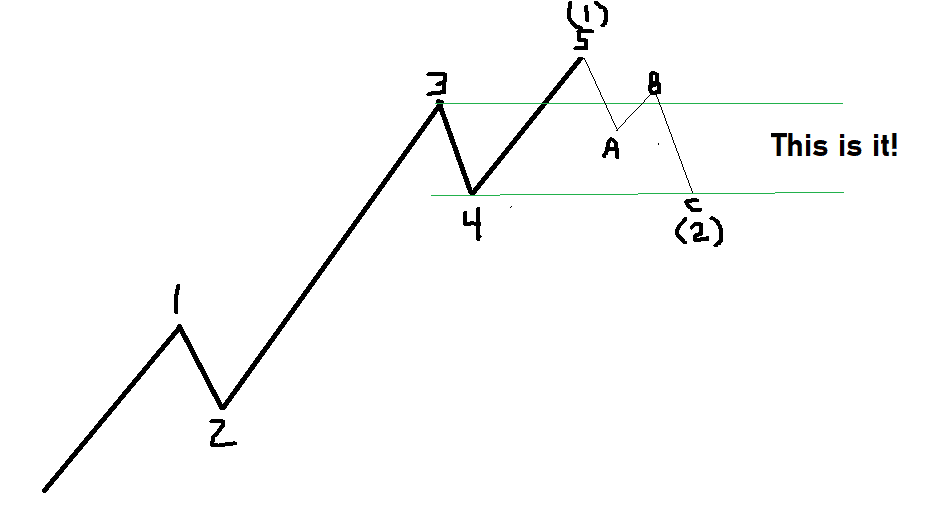
Trade secret time, kiddies! Want to know where most Elliott wave analysts get their first and best target from? This one little guideline from page 66 of Elliott Wave Principle, which says that:
Corrections, especially when they themselves are fourth waves, tend to “register their maximum retracement within the span of travel of the previous fourth wave of one lesser degree, most commonly near the level of its terminus.”
Man, that’s a mouthful isn’t it? These guys must be super smart!
Nah, take a chill pill. See the green lines going thru the ends of waves 3 and 4? The area between them is the previous fourth wave span. That lesser degree stuff? Well, waves 1-5 complete wave (1) which is one bigger degree than any of its components, so the wave (2) correction ends here near wave 4 which is one lesser degree! It ain’t rocket science, folks!
Oh, and that bit about “terminus?” Another fancy name for the end of wave 4. And this works whether you’re looking at a 5-minute chart or a 50 year chart, or anything in between!
Done! Now you too can forecast like a pro, impress your friends and find fame and fortune! Get going!!
It’s Earnings Season! Up is Good and Down is Bad, Right?
Every quarter, the mainstream media is full of headlines that spew the so-called “conventional wisdom” that good earnings equate to higher stock prices and poor earnings to lower prices.
Let’s see how that’s working out!
This morning, Intel announced weak quarterly earnings and the stock opened down 9%. OK, so that one makes sense.
BUT, at the same time, Amex announced that it missed profit estimates in Q4 and the stock traded….up 10%???
Wait, what? Seems like we might need some extra “guidance” on that one!
Robert Prechter, in The Socionomic Theory of Finance, has this to say:
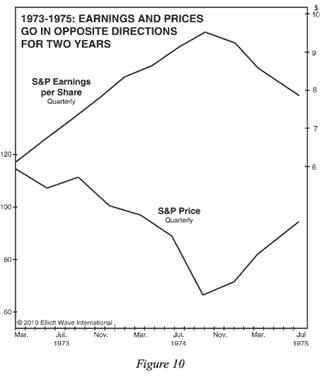
Suppose you knew that corporate earnings would rise strongly for the next six quarters straight. Would you buy stocks? Figure 10 shows that in 1973-1974, earnings per share for S&P 500 companies soared for six quarters in a row, during which time the same companies’ stock prices suffered their largest collapse since 1937-1942. This is not a small departure from the expected relationship but a history-making departure. Moreover, the S&P bottomed in early October 1974, and earnings per share then turned down for twelve straight months, just as the S&P turned up! A speculator with foreknowledge of these earnings trends would have made two perfectly incorrect decisions, buying near the top of the market and selling at the bottom. Such glaring exceptions to the idea of a causal relationship between corporate earnings and stock prices pose a challenge for conventional economic theory.
In real life, no one knows what earnings will do, so no one would have made such bad decisions on the basis of foreknowledge. Unfortunately, the basis that investors actually use is estimated earnings, which incorporate analysts’ lagging trend-extrapolation bias (see Chapters 17 and 21), making their investment decisions often even worse timed than advance knowledge of earnings would allow.
In April 1984, before many of us were born, Bob Prechter won the US Trading Championship, Options Division, returning 444% in a 3-month period. How did he do it?
“I mean an objectively definable method. One that is thought out in its entirety to the extent that if someone asks you how you make your decisions, you can explain it to him, and if he asks you again in six months, he will receive the same answer. This is not to say that a method cannot be altered or improved; it must, however, be developed as a totality before it is implemented. A prerequisite for obtaining a method is acceptance of the fact that perfection is not achievable. People who demand it are wasting their time searching for the Holy Grail, and they will never get beyond this first step of obtaining a method. I chose to use, for my decision making, an approach which was explained in our book, ELLIOTT WAVE PRINCIPLE. I think the Wave Principle is the best way to understand the framework of a market and where prices are within that framework.”
What’s the best leading indicator for the economy? That’s easy: The stock market.
Even so, other variables can also serve as leading economic indicators.
And, as you can see in the chart below, there are times when a measure such as the Conference Board U.S. Leading Economic Index can be valuable indeed… like right now.
Similar readings to today in the Conference Board LEI slightly preceded or accompanied all eight recessions since the 1960s but say little about its ultimate severity. Many economists today say they expect a recession, but most don’t see it lasting the full year and don’t think it will be so bad. But based on what? After all, these same economists didn’t even SEE a recession coming at the beginning of last year.
At EWI, we look at all these factors through the lens of the Elliott Wave Principle, which provides the backbone of our analysis.
The chart above was included in our December Elliott Wave Financial Forecast. To read the commentary – and the rest of the issue – check out our Financial Forecast Service.
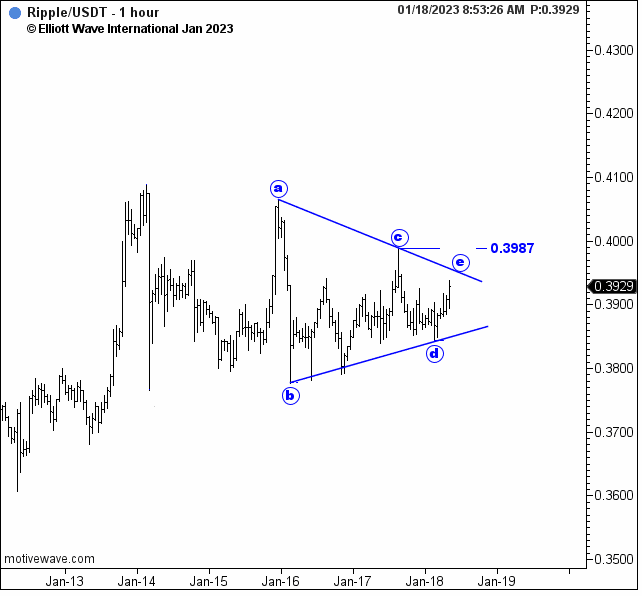
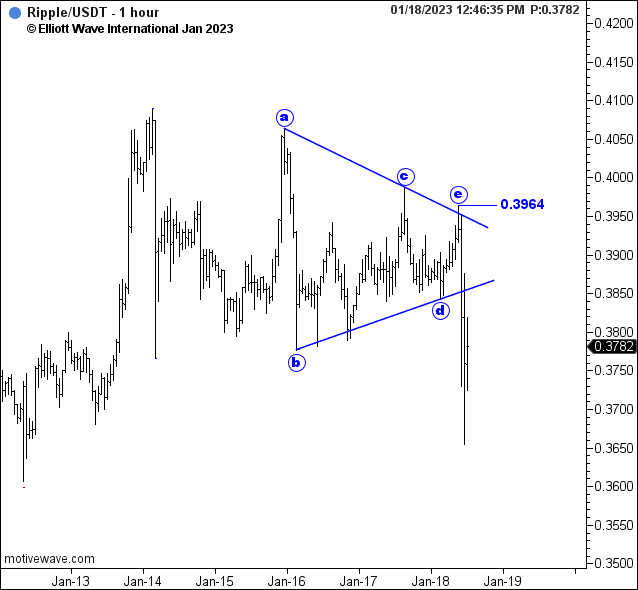
Elliott Wave Principle defines a triangle as a sideways movement usually associated with decreasing volatility. Sounds kinda boring. But in fact, it’s just the opposite — this Elliott wave pattern is a favorite among traders.
Why? Because triangles are often followed by a swift, sharp move and their structure makes them ideal candidates for low risk/ high reward set-ups!