Paul Montgomery’s Magazine Cover Indicator postulates that by the time a financial asset makes it to the cover of a well-known news weekly, the existing trend has been going on for so long that it’s getting close to a reversal.
A classic case in point is this Time magazine cover from June 13, 2005:

As you can see, it says, “Home $weet Home,” followed by “Why we’re going gaga over real estate.”
Interestingly, this was published around the time that the S&P Supercomposite Homebuilding index was peaking. The housing bubble of that time was on the verge of bursting, and you’ll likely remember that major crash.
Fast forward and here’s what was shown on the March 2 – 8, 2024 Economist cover:
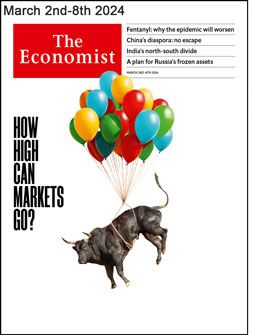
As a large cluster of balloons carries a bull upward, it asks, “How High Can Markets Go?”
Our March Elliott Wave Financial Forecast said:
It is a bearish signal for stocks. … In the context of the multitude of other sentiment extremes …, as well as a fully mature wave pattern, we think this cover is meaningful.
Just a few weeks after that was published, the Dow Industrials hit a high of 39,889 on March 21. The NASDAQ indexes also topped on that date.
As you probably know, the stock market has trended lower since. Only time will tell if the downward turn morphs into a major bear market.
Also know, from a technical analysis point of view, that the price pattern of the Dow Industrials is also sending a major message.
Get our detailed Elliott wave analysis of U.S. stocks, bonds, gold, silver and the U.S. Dollar by following the link below.
Why You Should Pay Attention to This Time-Tested Indicator Now
“How High Can Markets Go?” – asks this magazine cover
Financial markets are full of paradoxes and irony. For example, when conviction about a financial trend is the most pronounced, that’s the very time to turn the most cautious. This famous indicator is sending a critical message.