Right now, volatility shows highest investor complacency in 4 years
Today’s extraordinary degree of financial optimism is captured in these two headlines:
- Is the bear case now dead? (Moneywise, Nov. 30)
- Stock-market ‘fear gauge’ tumbles to nearly 4-year low (Marketwatch Nov. 28)
As you’re probably aware, the stock-market “fear gauge” refers to the CBOE Volatility Index (VIX), into which a past Elliott Wave Theorist provides some insight:
The Volatility Index (VIX) is billed as a measure of investors’ expectations for future volatility, but in fact it is nothing but a present measure of fear vs. complacency.
On Nov. 24, the VIX closed at 12.46, the lowest close since January 2020.
Speaking of which, our January 24, 2020 U.S. Short Term Update showed this chart and said:
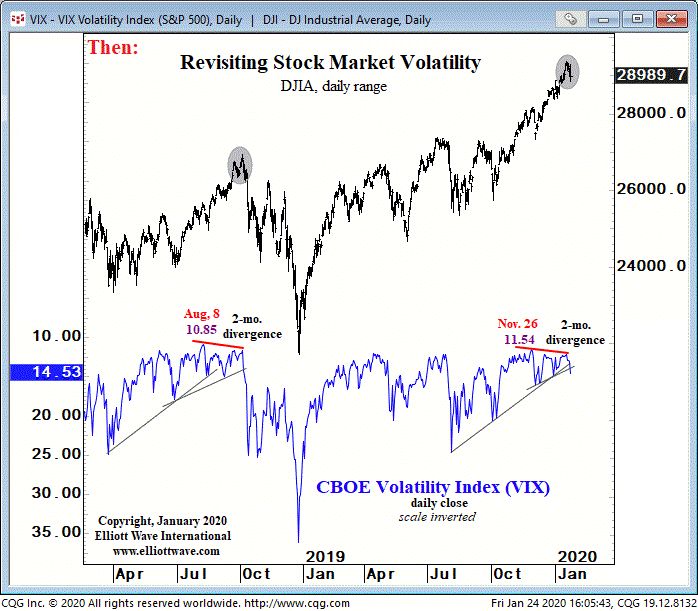
The VIX’s closing low during the recent market advance occurred at 11.54 on November 26 [2019.] The VIX has not made a new extreme since then, even though stocks have continued higher. … Might this measure of expected market volatility be signaling an impending volatility jump? It would be compatible with the message conveyed by the extreme bullish sentiment.
Two weeks later, in February 2020, the market topped and began plummeting.
Regarding bullish sentiment, as we return to 2023, here’s another headline – this one from Nov. 28 (Marketwatch):
Deutsche Bank makes the highest S&P 500 forecast on Wall Street — and says that may be too conservative
Deutsche is calling for the S&P 500 to hit 5,100 in 2024. Not far behind, RBC and Bank of America have 5,000 level targets.
Of course, only time will tell what the stock market will do.
Elliott Wave International’s analysis is based on the repetitive patterns of crowd behavior, and you may want to check it out.
You’ll also find illuminating analysis of the VIX in relationship to what appears to be an ongoing cycle which has been in place for six years now as you read our just-published December Elliott Wave Financial Forecast – just follow the link below.
Read the Just-Published December Elliott Wave Financial Forecast
The December Elliott Wave Financial Forecast – a monthly publication which covers major U.S. financial markets – offers you in-depth analysis of the investor psychology (or crowd behavior) which drives all major financial market trends.
Traditional financial news often focuses on “fundamentals” or news and events. Yet our research reveals that “fundamentals” cannot be relied upon as a basis for financial forecasting.
Ours is a “technical” approach – based upon Elliott wave chart patterns.
Learn more as you follow the link below.