“… 24% of U.S. single family homes are owned by investors.”
A big reason that U.S. home prices have skyrocketed is that big investors like corporations did a lot of buying.
As a Redfin.com headline noted nearly two years ago (Feb. 16, 2022):
Real Estate Investors Are Buying a Record Share of U.S. Homes
Redfin defined an “investor” as any institution or business which purchases residential real estate.
As Elliott Wave International has said, when houses are treated like stock certificates instead of shelter, prices can rise and fall just like with the stock market.
The February 2023 Elliott Wave Theorist explained that what occurred with the housing boom 15-20 years ago has been happening again:
Today, real estate prices have reached absurdly high prices because corporate investors have taken over the housing market from individuals in a program encouraged, once again, by the federal government.
Robert Prechter’s book, The Socionomic Theory of Finance, drives the point home in a nutshell:
When the bulk of participants in the market are consumers who think of houses as shelter, prices are stable. When a significant portion of participants in the market are speculators who think of houses as investment items, prices soar and crash.
So, we know that prices have already soared. Is a crash just around the corner?
Here’s a chart which shows the portion of U.S. home purchases made by landlords with 1,000 or more houses and commentary from our December Elliott Wave Financial Forecast:
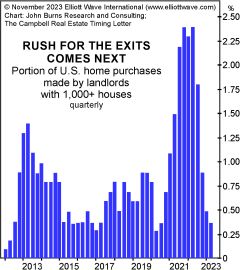
The chart [reveals] the percentage of U.S. homes purchased by landlords who own more than 1,000 homes [and] shows the unrivaled extent to which homes became financial assets…
The sharp decline from 2.5% of all home purchases to less than 0.4% represents another light-switch decline for the economy. At this point, ATTOM Data Solutions, a provider of U.S. property data, notes that 24% of U.S. single family homes are owned by investors. If 10% went on the market in the next year, 2.4 million homes, the inventory of homes for sale would triple from current levels.
One thing we do know is that the median price for new homes sold in the U.S. is beginning to decline.
This is not surprising because history shows that a slackening off of home sales generally precedes a drop in prices, and the peak in new home sales occurred in August 2020. Here’s the latest headline on that front (Reuters, Dec. 22):
US new home sales fall to one-year low in November
What’s also important to keep in mind is that real estate prices typically follow the stock market. Both are governed by the trend in social mood, which expresses itself as Elliott wave patterns on price charts. That’s why, if you’re looking to buy or sell a home, or simply want to get a high-confidence idea of whether the value of your home will be higher or lower in the months and years ahead, you may want to keep an eye on the stock market trends. Our publications help you do that — plus, they give you a chance to check out the entirety of our financial analysis for the U.S.
You may do so by following the link below.
How Do You Handle Financial Uncertainty?
If you are unsure about how to position your portfolio, put the current financial scene into context.
As Frost & Prechter’s Wall Street classic, Elliott Wave Principle: Key to Market Behavior, notes:
The primary value of the Wave Principle is that it provides a context for market analysis. This context provides both a basis for disciplined thinking and a perspective on the market’s general position and outlook. At times, its accuracy in identifying, and even anticipating, changes in direction is almost unbelievable.
Of course, even putting the behavior of a financial market into context offers no guarantees, yet we see it as a highly useful exercise.
Get our Elliott wave analysis for U.S. stocks, bonds, gold, silver, the U.S. Dollar (and more) by following the link below.