TJX Companies hit a new 52-week high today
The law of “fundamental” market analysis asserts that price trends are driven by news items circulating in or near the backdrop of a certain company’s stock, including but not limited to:
Earnings data, revenue, competitor growth, insider trading activity, ratings reports, new product launches and technologies, mergers and restructuring, the overall performance of the larger market, hedge fund investment, managerial changes, and on and on and don’t get me started on the endlessly spewing firehose of data being monitored regarding commodities.
Every one of these events is a moving target. No trader, no matter how many Google alerts they have on their devices, can keep up with them in real-time. That’s IF they’re paying that close of attention. More commonly, traders just pile onto a trend, and use market “fundamentals” to justify their emotionally-driven decisions – after the fact.
For a far more objective view of the market, consider that the answer to where stock prices are headed is NOT in its “fundamental” backdrop at all. But rather, directly on the price charts themselves as objective, Elliott wave patterns.
Here, price mirrors group investor psychology, which swings from excessive optimism to pessimism and back again, forming repeating patterns on price charts. These patterns, not the news or any subjective thought or feeling about the future – are the final arbiter of market trends.
There are 13 known Elliott wave price patterns, and among those 5 are “core” Elliott wave patterns: impulse, ending diagonal, zigzag, flat and triangle. In turn, the challenge for every Elliottician is two-fold; memorize the unique traits and guidelines of each pattern, and then wait for one to appear in real time.
Let’s take a real-world example with the recent performance of TJX Companies, Inc.
Elliott wave analysis streamlines the decision process by asserting that price patterns are the primary,
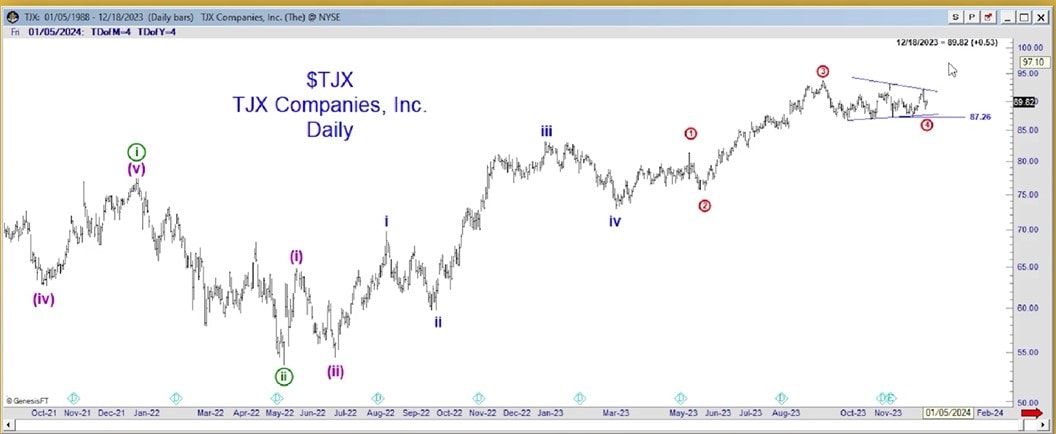
On December 19, our Trader’s Classroom video lesson zoomed in on the Big Board discount retailer, ticker symbol TJX. There, one of the 6 Trader’s Classroom instructors, Robert Kelley, identified one of the most recognizable Elliott wave patterns: a diagonal.
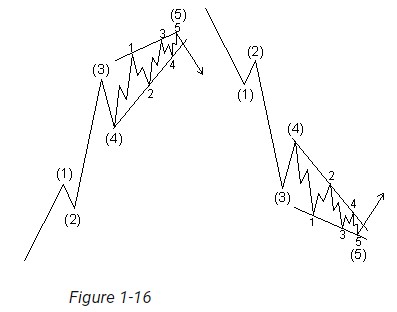
The paramount guidebook Elliott Wave Principle – Key to Market Behavior defines the diagonal as a five-wave motive pattern “in which all the waves are ‘threes,’ producing an overall count of 3-3-3-3.” Most important, diagonals are terminating patterns that can only form in the fifth wave position of an impulse, or as wave C of an ABC formation
As terminating patterns, diagonals imply one thing: “dramatic reversal ahead.”
(Pictured here: Diagonals preceding bearish and bullish reversals.)

With the diagonal complete, the December 19 Trader’s Classroom set the stage for a bullish thrust to new highs:
“87.26 is the level we expect to hold above here in the near-term and lead to a thrust on up on up to 95. From there you can begin to look for a new high.”

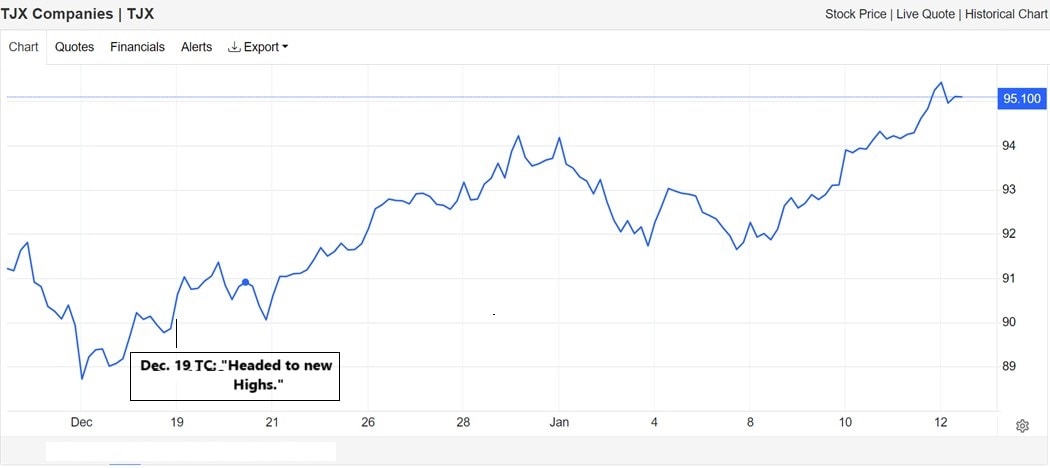
This follow-up chart of TJX shows how prices swiftly took to the upside in a thrust to record highs on Jan. 12. (Source: Trading Economics)

And notice that not once did either forecast cite a single “market fundamental”!
As I am typing this, TJX Companies stock has just hit a new 52-week high.
Of course, not all Elliott wave interpretations of price action turn out to be right. But they remove the noise of “fundamentals” and give you objectively derived, critical price levels that help minimize risk and manage reward along the way.
Trading Lessons (Plus, Market Opportunities): 2 for 1
3 times a week, press “Play” and watch one of our 6 experienced analysts explain in comprehensive detail how to recognize the relevant Elliott wave patterns (and supporting technical indicators) underway now and in the future.
This is every Trader’s Classroom video in a nutshell: a lesson, often with a new opportunity in a wide swath of markets from individual stocks, cryptocurrencies, commodities, and more.
Here’s how to watch the latest lessons now.
