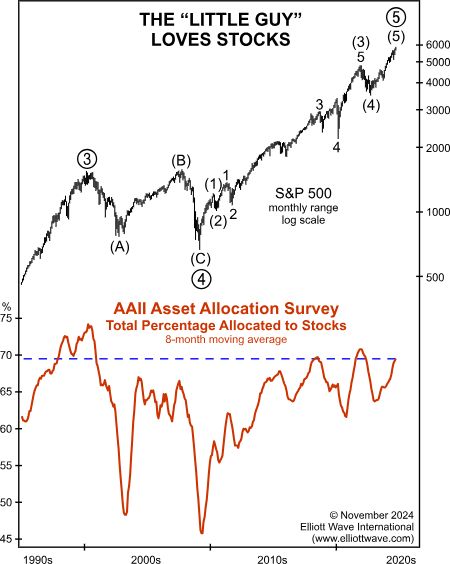
The U.S. stock market is worth twice annual U.S. gross domestic product. That means it’s the most expensive stock market ever. Are Main Street investors worried? Hardly. Our November Elliott Wave Financial Forecast reveals their behavior:
The AAII Asset Allocation Survey polls members each month on their current holdings among five asset categories. The question they ask is: What percentage of your investment portfolio is in stocks, stock funds, bonds, bond funds and cash? Unlike the weekly AAII sentiment survey, which attempts to gauge how investors feel about stocks, the asset allocation survey reveals what they are doing. As the chart below shows, their average 8-month allotment to stocks is in the upper quadrant of all allocations over the past 34 years:

It was briefly higher at the market top in late 2021 and early 2022 as well as the end of the dot-com mania in 2000. The trend rises when investors become more bullish, and the trend declines when they become more bearish, and this chart is a great example. When the stock rally morphs into a punishing bear market, AAII investors will be caught in a wrong way bet on equities and will start liquidating their stocks, just like they did during each bear market wave during Primary wave 4. It’s an immutable feature of herding.
Are professionals on Wall Street and corporate insiders behaving any differently from the “little guy”? Get the insights you need by accessing our flagship services at a special combo price by following this link.
If you want to sample more of our analysis before subscribing, check out our Sentiment Special Report – it’s FREE!