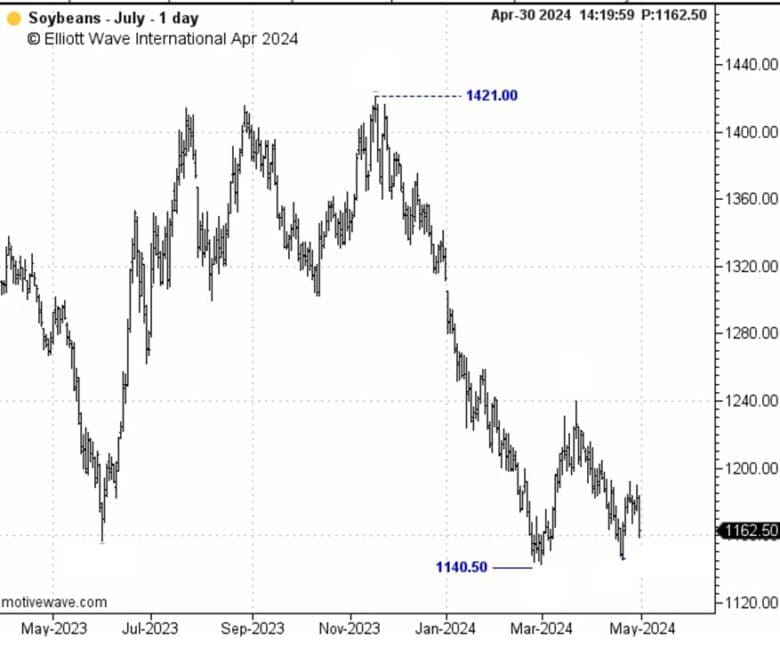
From 3-year lows to multi-month highs, soy prices have been taking cues from their Elliott wave conductor.
Depending on where you live in the U.S., you may have experienced the deafening noise of the once-in-221-years cicada co-emergence. Where I live in Georgia, it sounds like a million miniature car alarms going off in unison in the distance from the time I wake up to the time I go to bed.
The other day, though, one single cicada landed on my arm, and I could hear its tiny, individual clicking cluck, a singular note that gets drowned out in the masses when it flies away.
When it comes to trading commodities, it’s incredibly challenging to tune into one, unique voice of objective reason amidst the deafening throng of “market fundamentals” viewpoints regarding the future of a certain market. Rarely do the news-watchers strike a harmonious chord, as the news is constantly changing.
Take, for example, the news articles covering the soy complex, which has taken many traders for a wild ride. To wit: As 2024 began, soybean and soybean meal plunged 30% to 3-year lows in late February, their worst annual start in 40 years (Jan. 9 Reuters). From there, prices trended sideways before striking a strong note in late April and rallying to multi-month highs.
The mainstream experts predicting soy prices have been as off-key as my great Aunt Gladys after three Long Island iced teas. These news items play the notes of discord:
- Bullish, but not sure why: “Soybean Prices May Be Ready to Rally… according to an agricultural economist. He has no clue what could cause the rally. He could offer up 10 reasons and it would be the 11th that would trigger the bull run.” (March 4 Producer.com)
- Bearish: “Funds Cut Bullish CBOT Soy and Meal Bets Ahead of Price Plunge” (March 27 Reuters)
- Undecided: “Soybean Prices Offer a Spring Riddle.” (April 22 DTN Progressive Farmer)
- Bullish because the early 2024 crash doesn’t make any “market fundamentals” sense: “Soybeans: Light at the End of the Tunnel… The soybean market’s underperformance has been a source of amazement for many traders, particularly since inflation’s presence should have theoretically bolstered agricultural commodity prices across the board. Factors such as weather conditions in Brazil, labor strikes in Argentina, increased soybean crushing demand in the US, and lower global production and exports support a bullish outlook for soybean prices. (May 6 Seeking Alpha)
But long before the soy rout-then-rally began, one single objective voice landed on the collective arm of commodity traders: Elliott wave analysis. On November 17, our Commodity Pro Service presented a long view of soybean and soymeal prices for the coming year. There, chief analyst Jim Martens said of soybeans:
“On the weekly continuation chart, a larger correction is underway. If we come into the January contract, 1141 is the equivalent level [for a thrust to the downside]. We’re probably going to see beans trade lower.”
This next chart shows what followed: Soybean prices turned down from a November high and plummeted 30% to 3-year lows in late February.
For soybean meal, Jim showed Commodity Pro Service subscribers this labeled price chart on November 17 and wrote:
“We’ve counted a corrective move up for wave B and are working wave C to the downside toward 332.
“The continuation chart tells us to look lower, the big picture is pointing lower, we look at the daily chart and we see the last rally attempt followed a corrective path. We’re just reporting what the market has done, where it is within the Elliott wave progression, and that progression tells us how the market should act and where it should go moving forward. This market is at risk of declining to a new low.”
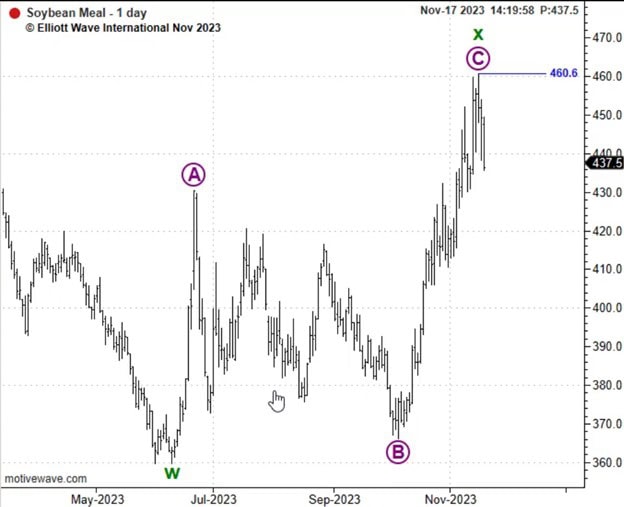
And, this next chart shows what happened to soymeal — a mirror image of soy’s sell off:
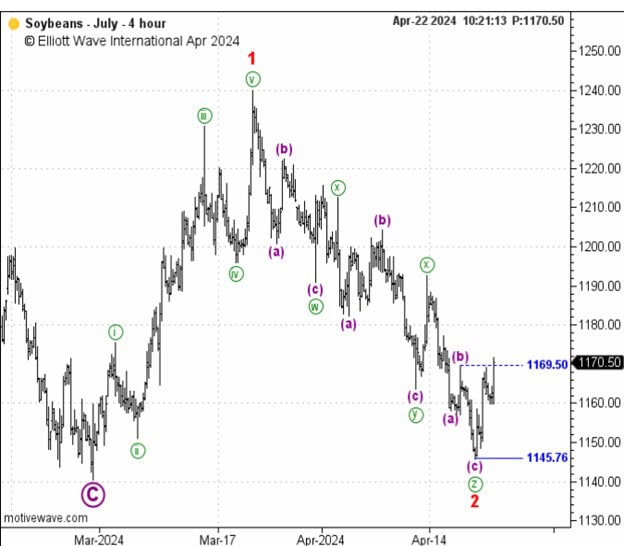
Then, after months of trading sideways, on April 22 Commodity Pro Service set the stage for a powerful upside reversal in soybeans with this chart and analysis:
“Not only did beans turn higher from above 114 1/2, but the rally from 1145 3/4 breached 1169 1/2 in five waves. The former broke the series of lower price lows and price highs, while the latter represents the first part of a bullish reversal sequence.”
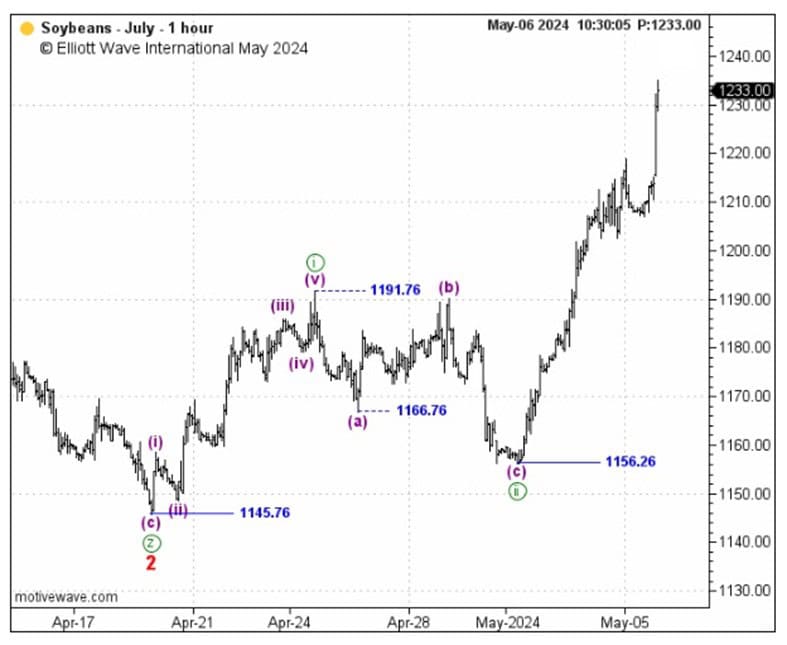
And as this chart from May 6 shows, soybeans have been bouncing since:
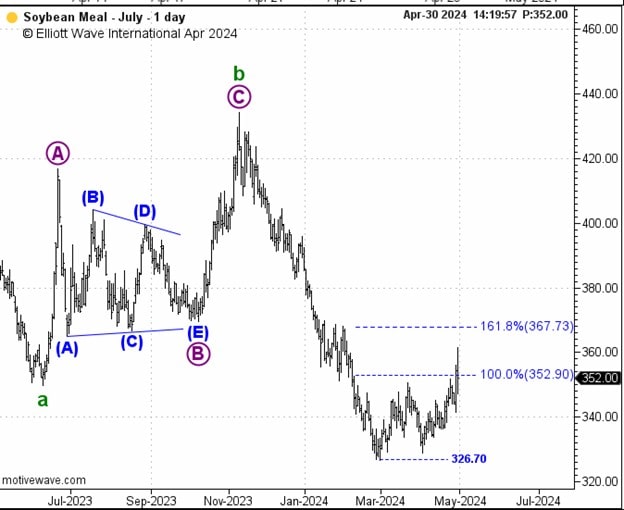
Admittedly, our complementary soybean meal analysis at the time called for a bearish triangle scenario, which did not come to pass. Fortunately, Commodity Pro Service identified critical levels of support to confirm a weakening trend was underway. Those levels have not been triggered… yet.
The fact is, no forecasting model is perfect. Elliott wave analysis is no exception. Our wave counts can be wrong, but because they define specific price levels to manage risk, traders never need sing the blues for long.
Commodities Sing a Song of Opportunity
When it comes to knowing the future of commodity prices, there’s no such thing as a silver bullet. Even the most jarring Black Swan events like that of the pandemic can’t accurately determine where prices will go.
The only confident measure of a market’s trend is investor psychology, which unfolds as Elliott wave patterns directly on price charts. Right now, our Commodity Pro Service presents high-confident outlooks for the world’s leading names in livestock, grains, softs, foods, and more.
See below to turn a new page in your investment future.