
On June 3, the Nasdaq 100 was at a record high.
But Robert Kelley, editor of EWI’s U.S. Stocks Pro Service, saw reason to be cautious. The index was tracing out an expanding ending diagonal — an uncommon Elliott wave pattern that can signal an advance is nearing exhaustion.
Here’s what Kelley told subscribers that day:
 Intraday Stocks Pro Service, June 3, 2026:
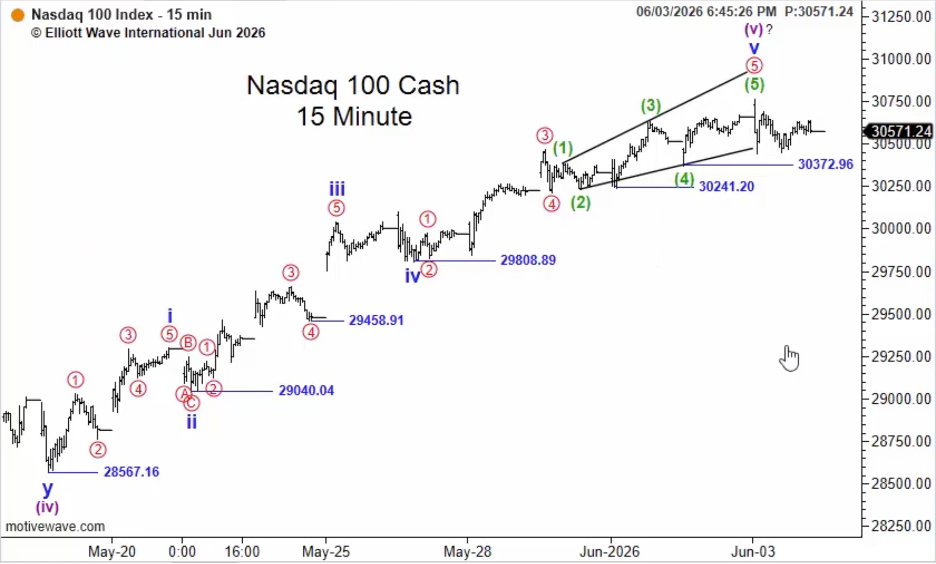
“All right, so there’s the Nasdaq. It did make a slight new high, making this a reasonably conforming ending diagonal. We didn’t quite get to the five is longer than three count, but in my book, that’s not really a big deal, not really required. I don’t think Elliott himself ever dictated that requirement.
“But so far, the drop isn’t looking too impulsive… but the count shows it could be done.”
He then gave subscribers two levels to watch:
“That’s a big support level there, 30,318, roughly. So if that can give way, it’s in good shape to go lower. And this last rebound high, I think probably should contain any recovery, 30,694.75.”
What Happened Next:
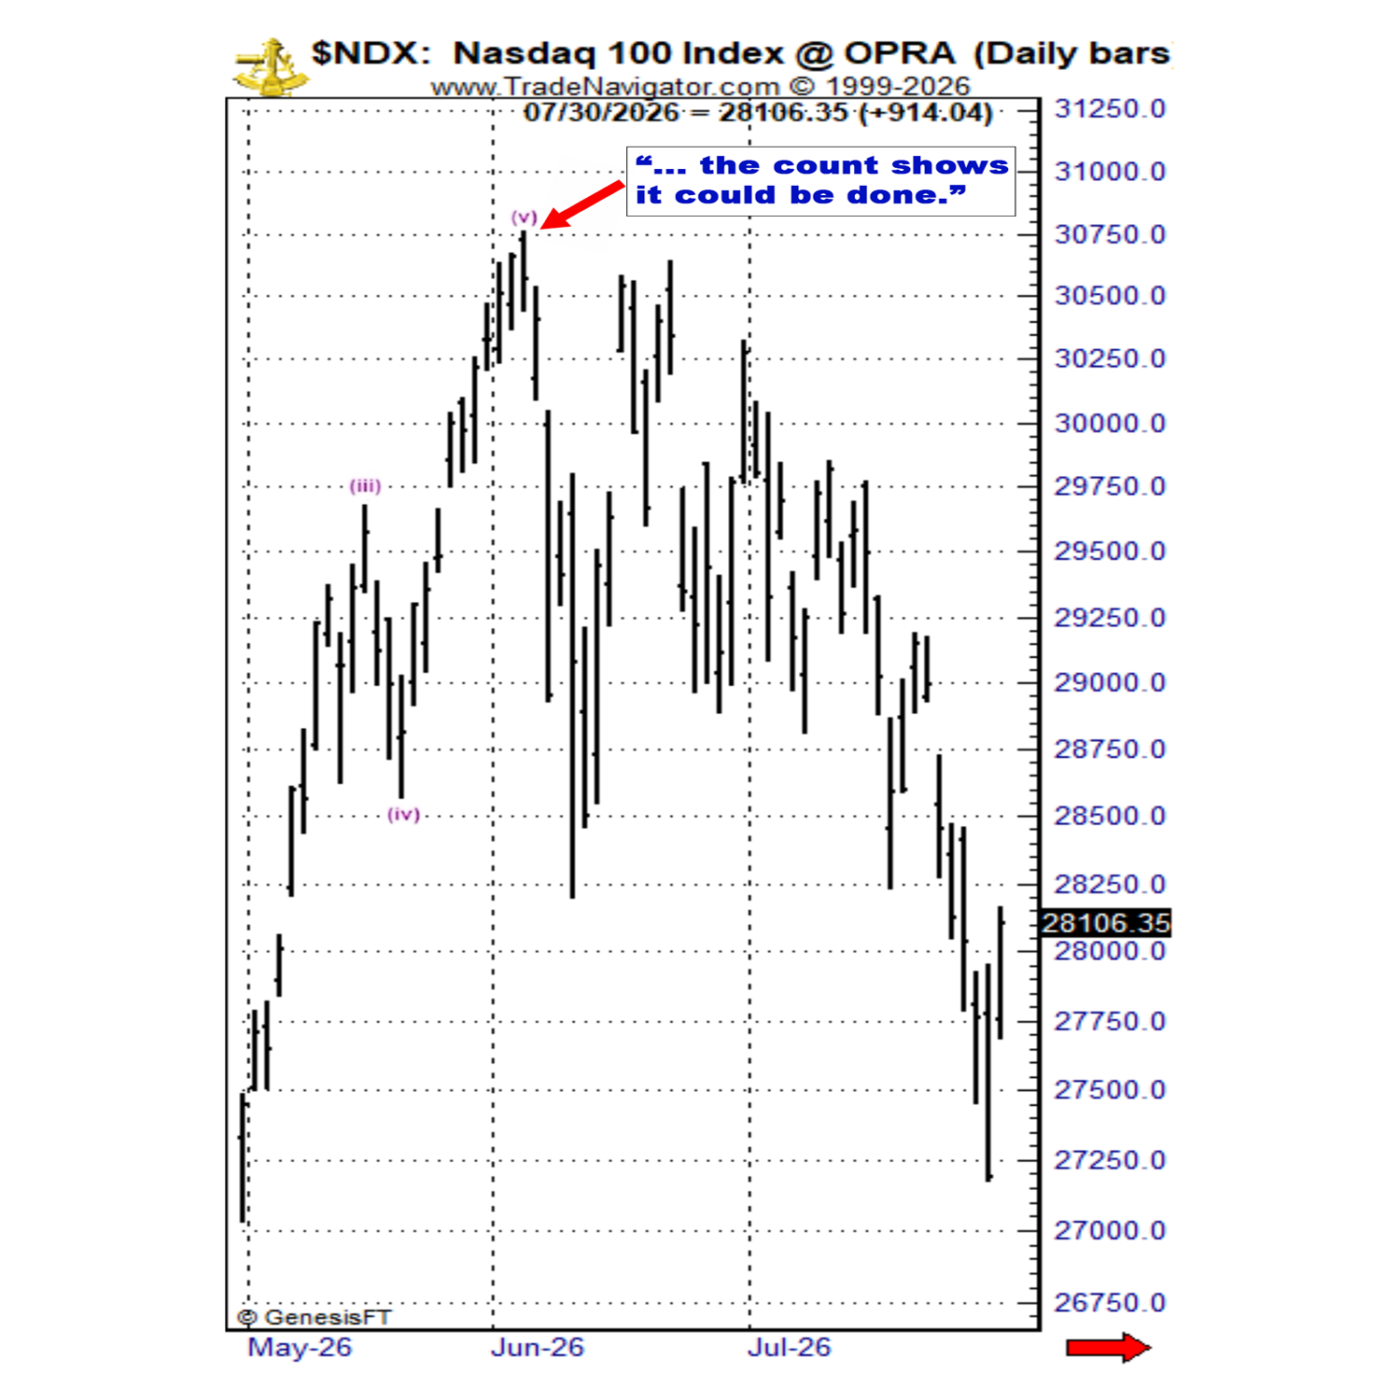
The Nasdaq 100 turned lower. By the end of July, it had fallen roughly 12% from its June high.
The important point isn’t simply that the market fell. At the high, while the prevailing trend was still up, the wave pattern gave Kelley reason to watch for a reversal — along with specific price levels that would help confirm or challenge that outlook.
That’s what EWI’s Pro Services are built to provide: ongoing Elliott wave analysis, key levels and potential turning points across the markets you follow.
Take a Test-Drive & See What EWI’s Pro Services Are Forecasting Now
Our 1-week, $77 Pro Services Test Drive gives you unrestricted access to the entire Pro Services lineup — the same intraday, daily and weekly updates our Pro Services subscribers get, on all key markets worldwide — for pennies on the dollar!

Want to Learn to Spot Elliott Wave Patterns Yourself?
The ending diagonal Kelley identified is one of the patterns you can learn to recognize in Trader’s Classroom.

EWI instructors show you how to identify developing wave patterns, understand what they may be signaling and apply the Wave Principle to real-world markets.

Robert Kelley Senior U.S. Equity Analyst & Trader’s Classroom Instructor
Robert Kelley, CEWA, joined EWI in 1990 and edited The Elliott Wave Short Term Update, the Currency and Commodity Hotline and the currency section of The Elliott Wave Currency and Commodity Forecast newsletter. After many years of passionately studying and trading options, he has assembled and taught a multi-part options trading course for EWI. He now produces video lessons for EWI’s popular Trader’s Classroom, an educational service that shows subscribers how to trade with wave analysis and supporting technical methods. He also provides intraday analysis for U.S. stock indexes in EWI’s Pro Services.