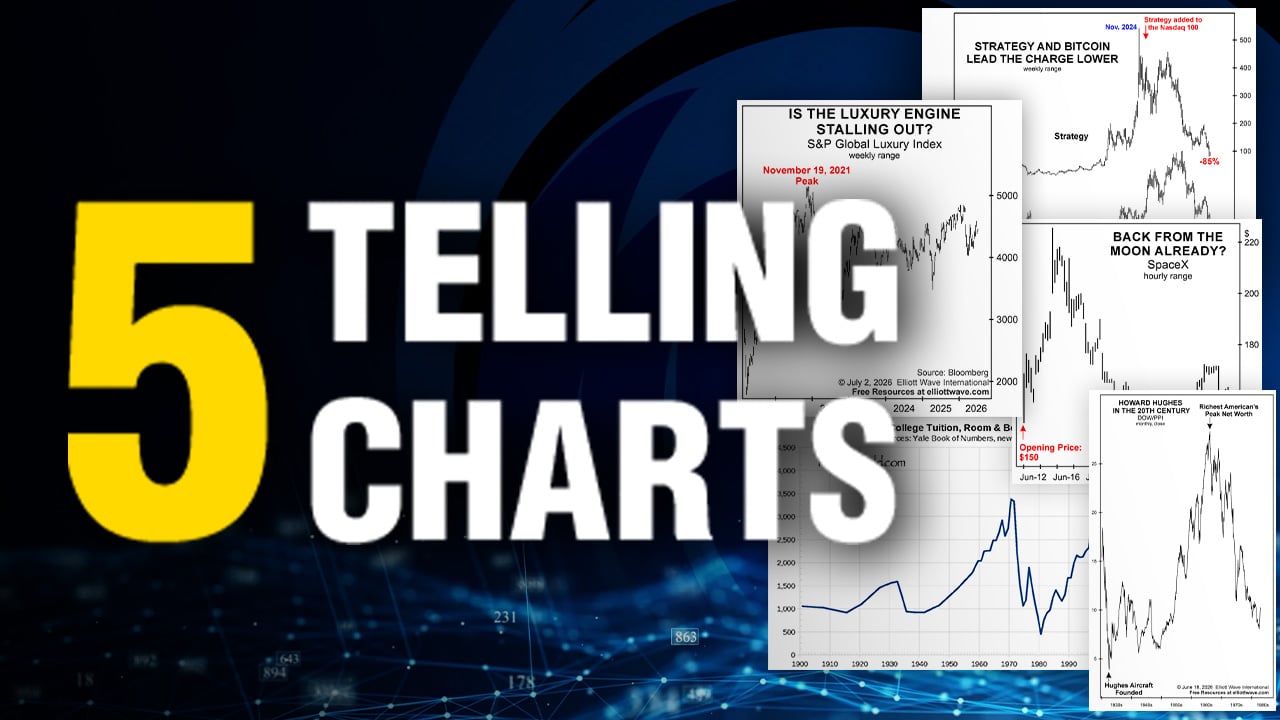
Here’s a near-term chart of the Euro-Dollar, the most actively traded currency pair. It shows the action from late June thru the morning of July 15th.
Note the bottom left arrow at the June 26 low: A strong rise in Eurodollar followed, which in fact carried to its highest level since March of this year. So let’s have a closer look at the late June low.
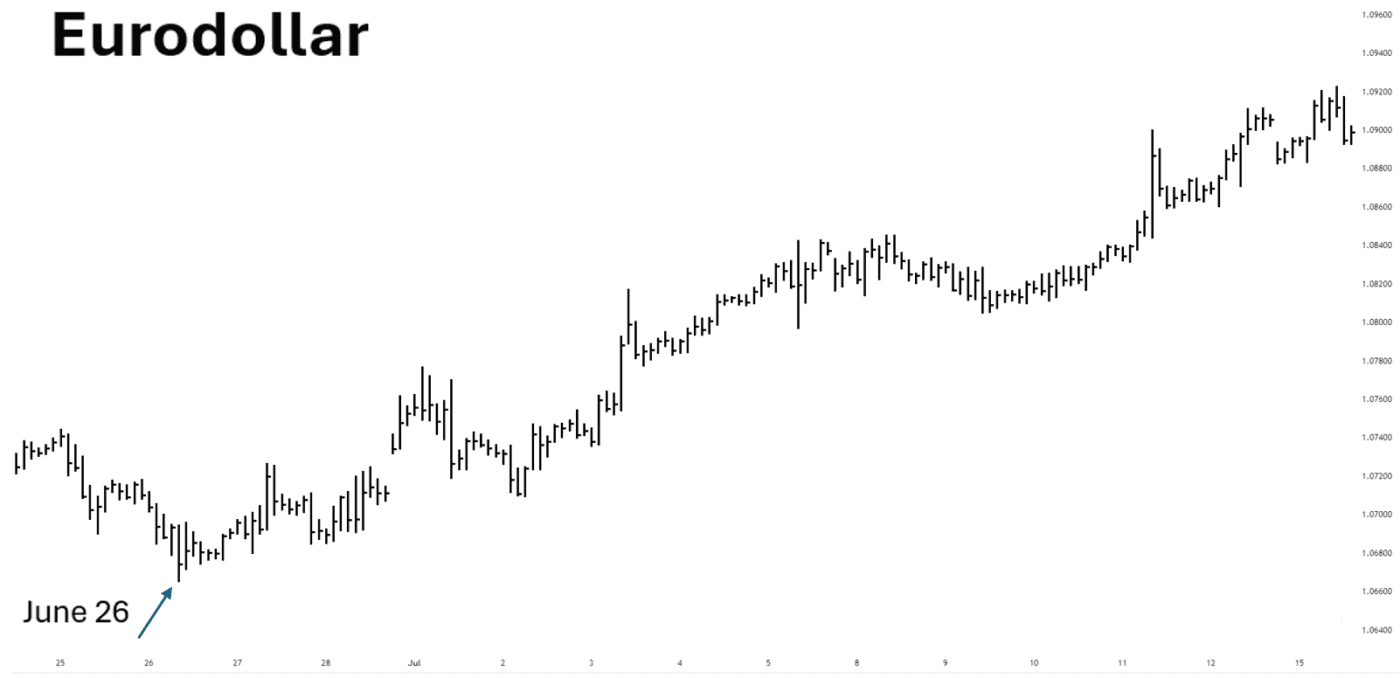
We showed subscribers a version of this chart on June 27th, before the big rally. We said that the previous day’s low meant a move at three degrees of trend was complete.
As for what “three degrees of trend” means, the short version is: A big move should follow – specifically, a big move higher. And with the chart, our forecast on June 27 said this to subscribers:
“EUR-USD now looks to have completed wave E at 1.0666 … the outlook is bullish against that level.”
What followed is, a strong upward rally to a four month high.
Not all forecasts work out this way — this Eurodollar pattern is still unfolding.
Read Our Forecasts Now … or Wait Till “Old News” Headlines Later
The point is to be on the right side of the opportunity. You’ve just seen a powerful example of forecasting a big trend reversal before it unfolds: Our subscribers were not surprised by the big natural gas rally.
If you’re an active investor who wants coverage of global interest rate markets, Global Rates & Money Flows offers charts and forecasts you won’t find elsewhere.
Get more information via the fast steps below.