Across our 15 subscription services, Elliott Wave International delivers a constant flow of professional insight — more than 12,500 charts, 300 videos and 100 pages of in-depth market analysis each month — produced by our team of experienced analysts.
Our Pro Services offer intensive coverage for traders and professionals.
Subscribers receive ongoing intraday, daily and weekly Elliott wave coverage — identifying developing setups, defining key levels and tracking wave structures as they unfold.
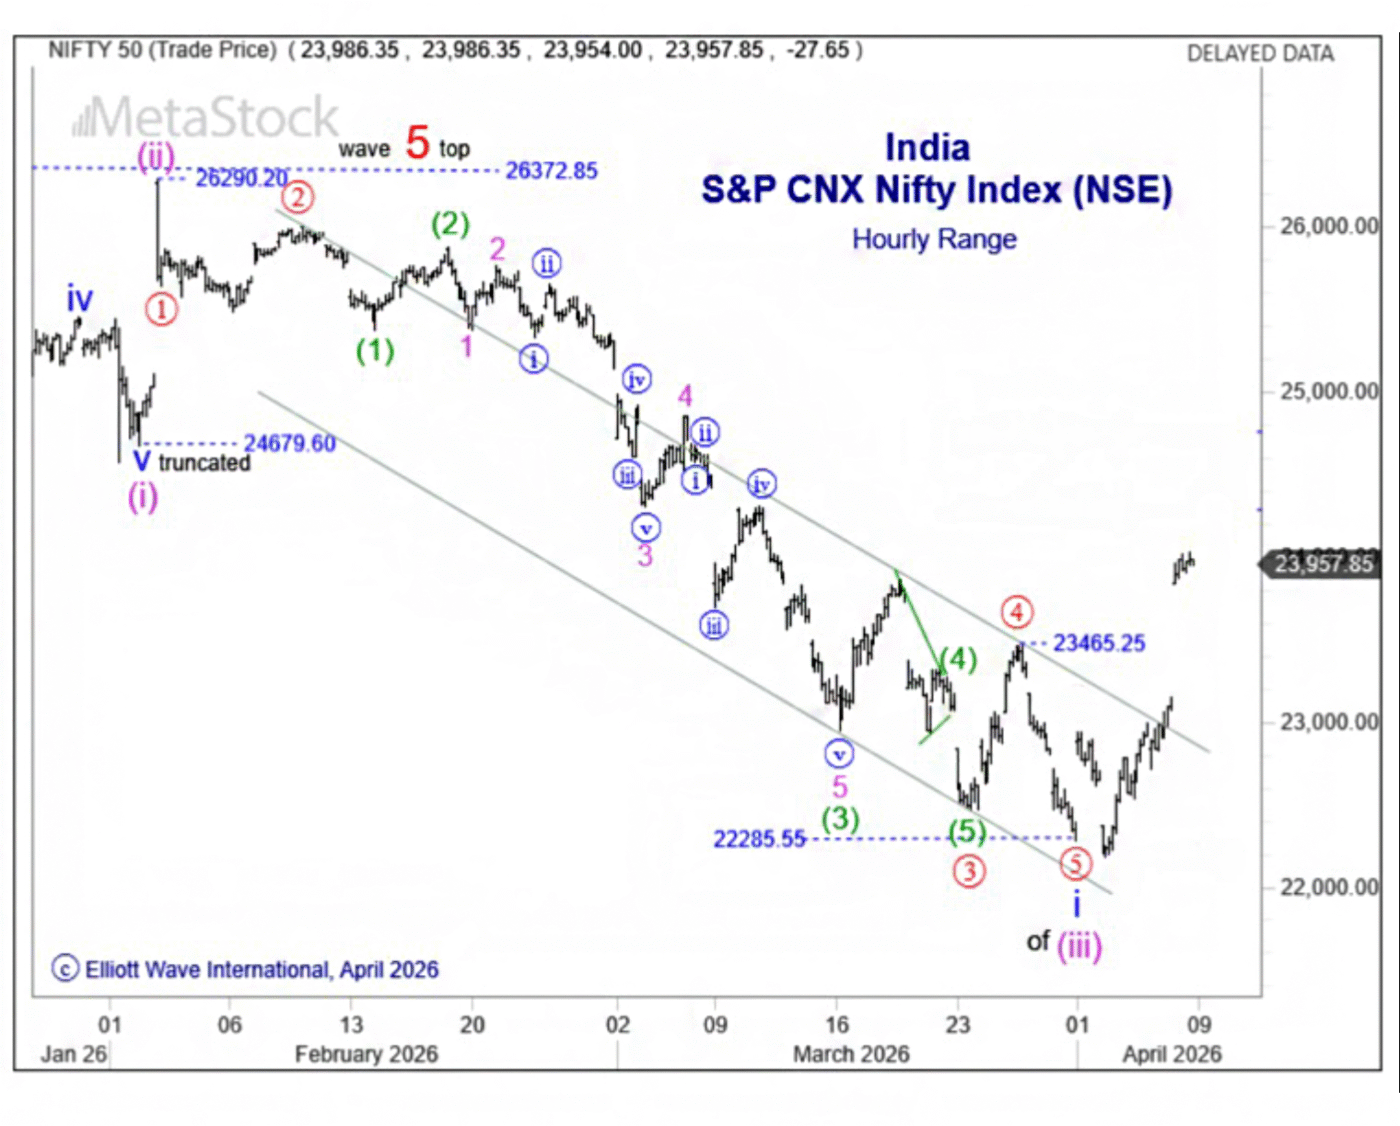
This is a real-market example of how our Intraday Asian Stocks Pro Services tracked a developing bearish impulsive wave structure in the Nifty 50 — from the initial setup through each stage of the decline.
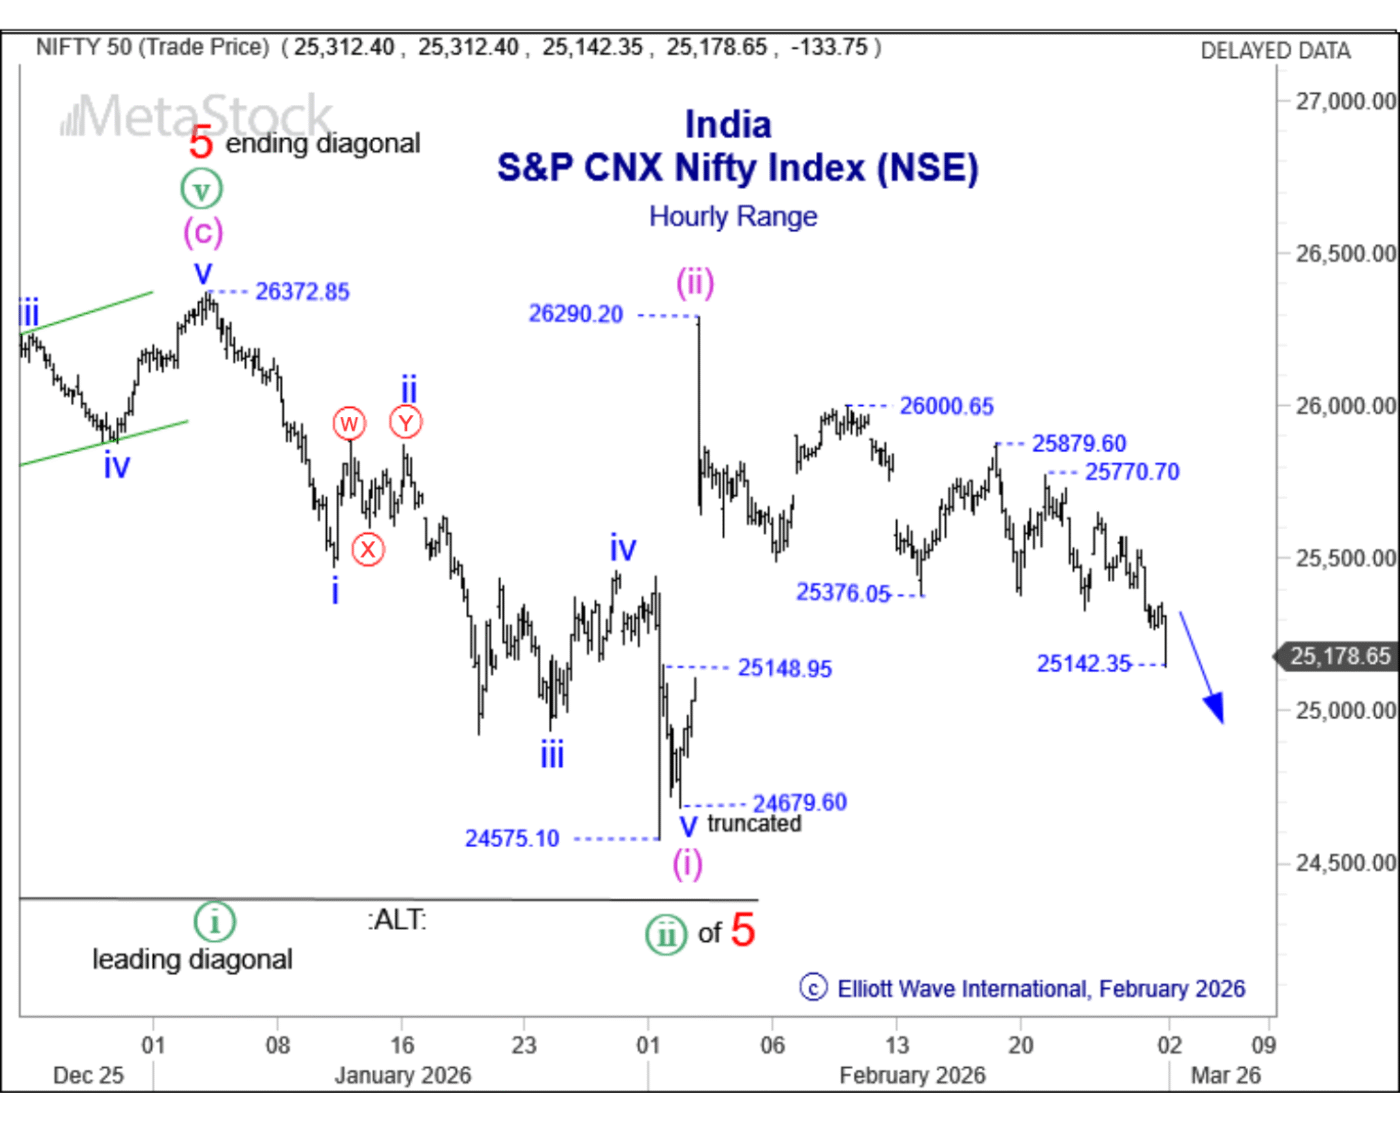
The Setup (February 3)
Analysis identified a potential ending diagonal top near 26,372. We showed this chart to subscribers and said:
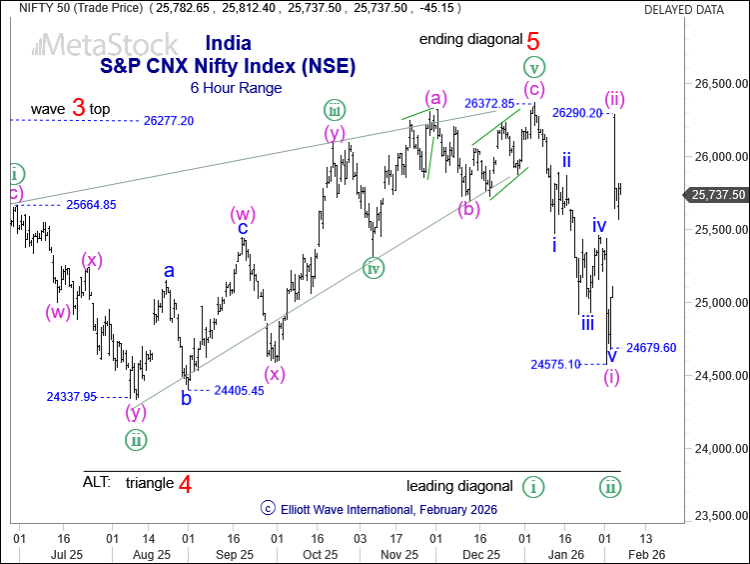
“A proposed wave 5 ending diagonal top is in place at 26372.
An impulsive five wave decline (with a truncated fifth wave leg) potentially ended at 24679. This is a bearish sign. The impulsive decline could be a first wave pattern.
A strong rise from 24679 ends below 26372. It could be a second wave correction, if the correction’s top at 26290 holds.”
At this stage, the groundwork was in place for a larger decline — if the structure continued to develop as expected.
Structure Begins to Take Shape (February 25-26)
Price action turned choppy — but not random. What we said on February 25:
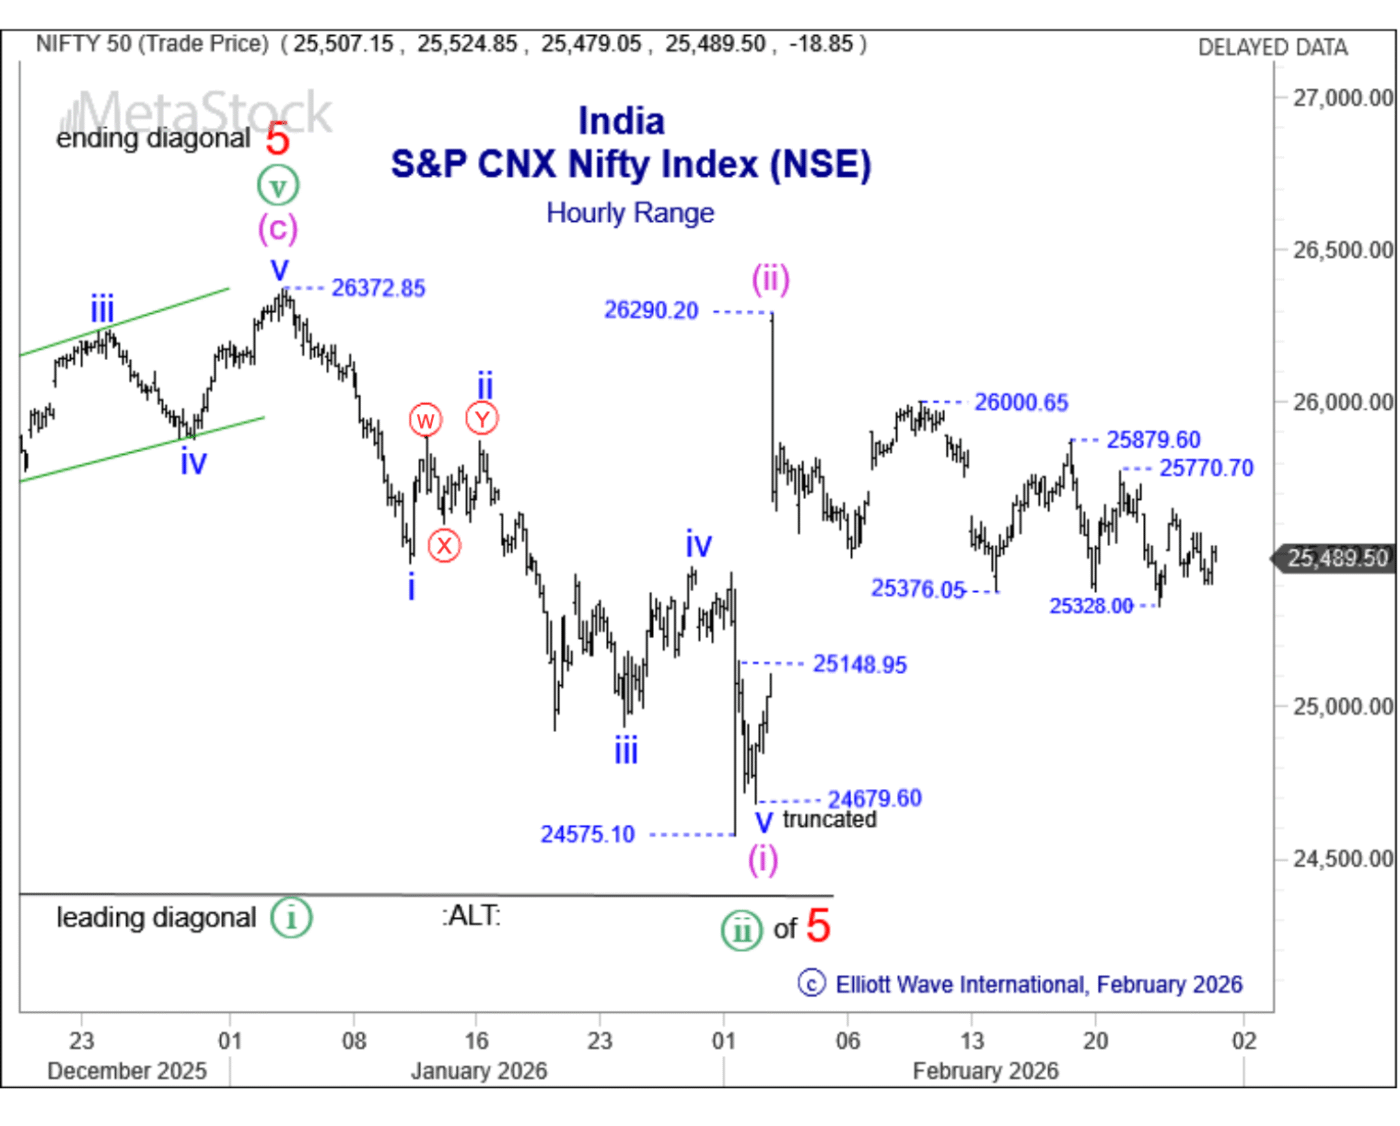
“A lot of choppy sideways action occurs beneath 26290. This makes the wave picture debatable at first. However, after a while a series of lower highs and lower lows is visible. This is a potentially bearish sign, as it could be a series of first and second waves forming.”
Then, what initially looked uncertain began resolving as the expected developing bearish impulsive structure.
What we said on February 26:
“Start of a break lower. This strengthens the bearish view. The move below 25148 increases the chances that the earlier rise to 26290 is the end of a three wave correction.”
Acceleration in Wave 3
The structure confirmed. A series of second waves gave way to a series of third waves, and the decline accelerated.
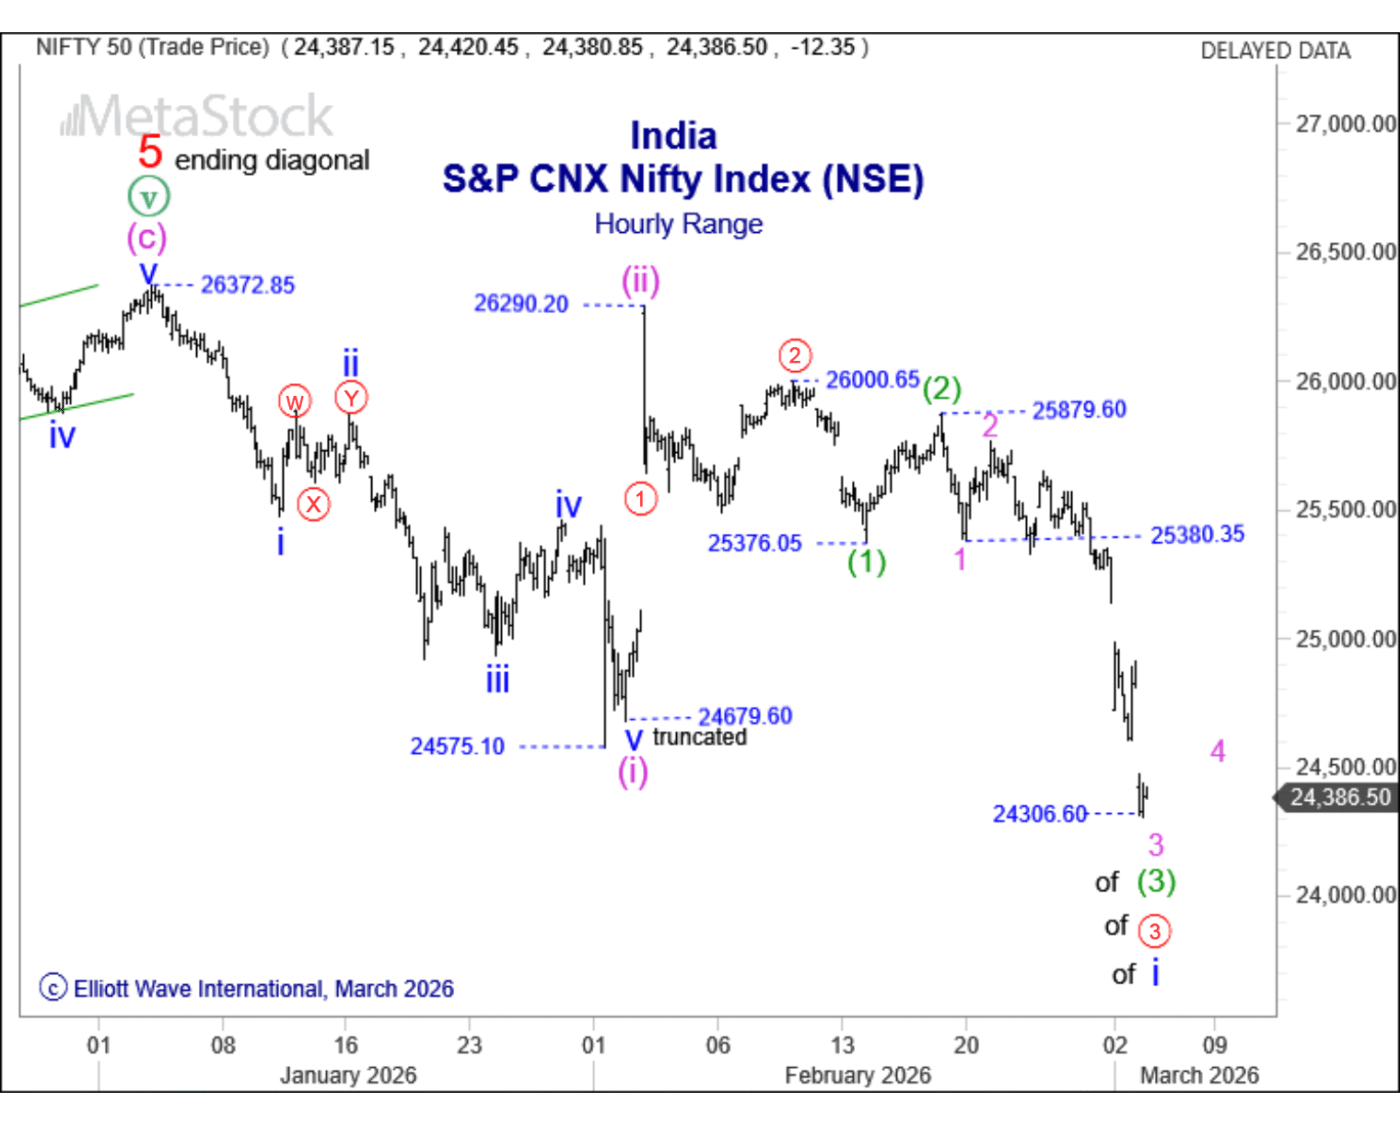
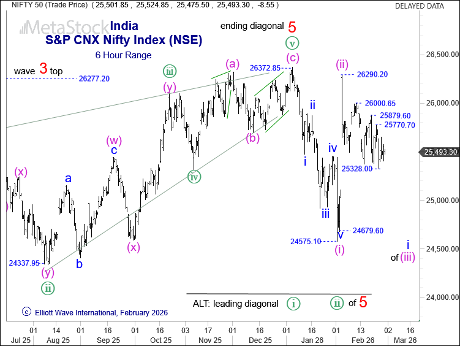
Wave 4 Pullback and Final Leg Down (March 3-18)
Our analyst, John Hunter, continued to track the impulsive structure’s progression in real time and sent this chart and update to subscribers on March 3rd:
“A wave 3 of (3) pattern from 25770 could have ended at 24306. This should start a series of fourth and fifth waves, which should finish off the series of third waves and eventually an impulsive wave I of (iii) pattern from 26290.”
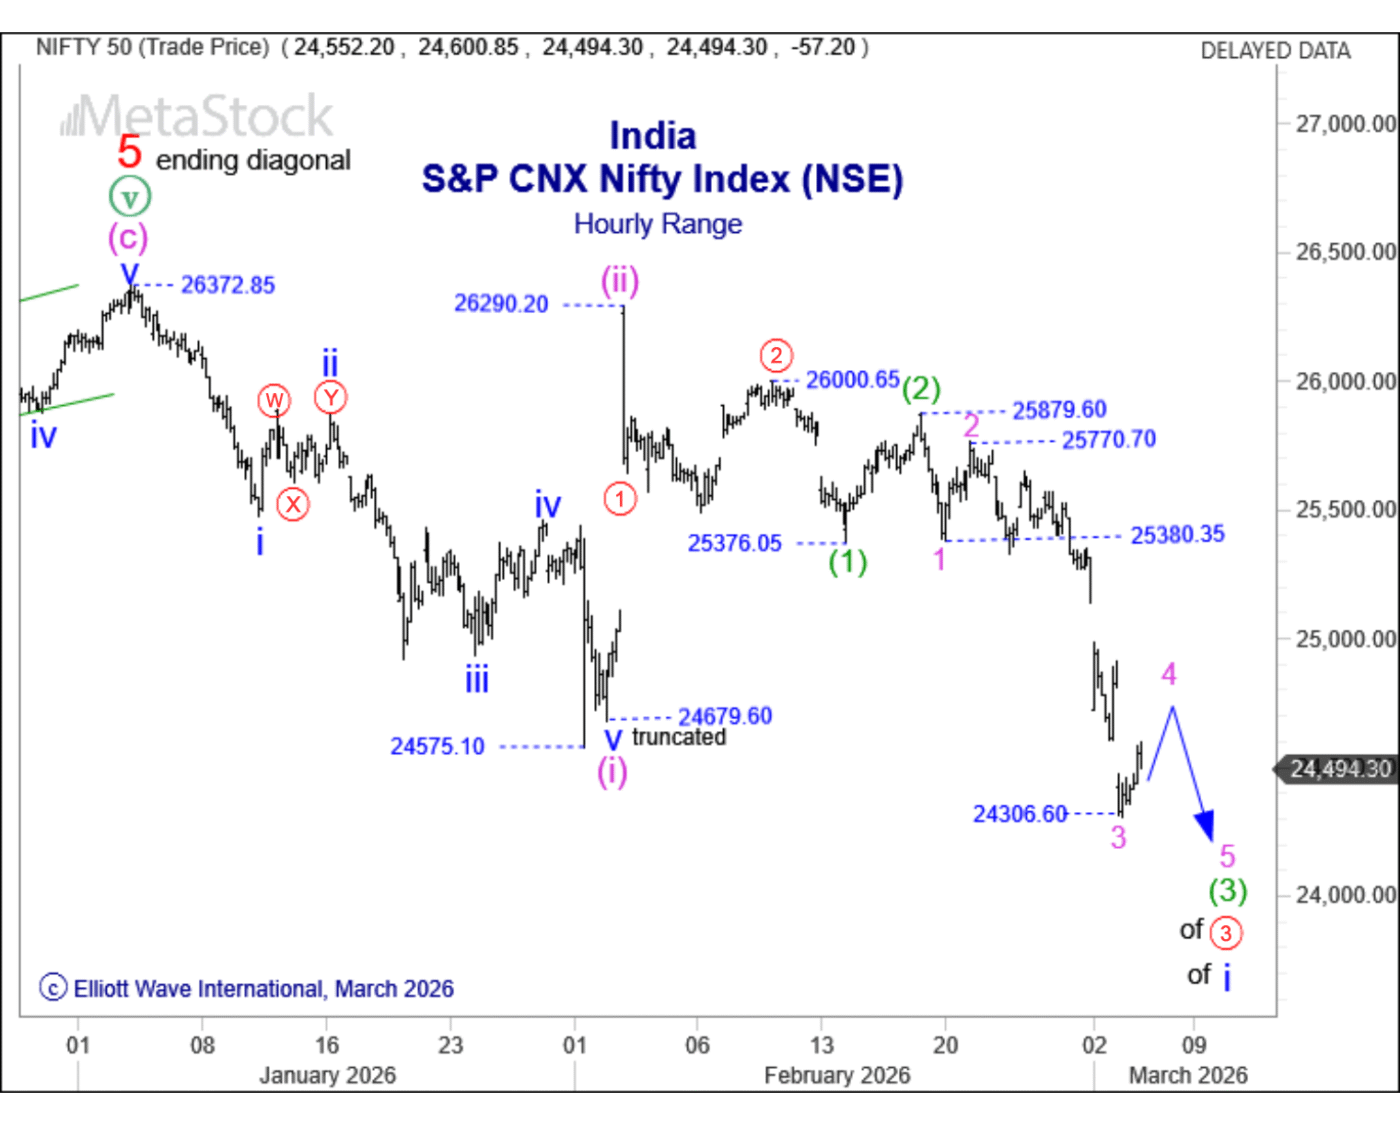
It did. Then on March 18th our analyst updated subscribers with this chart and said:
“Heading down to the potential end of the series of fourth and fifth waves and therefore to the bottom of the impulsive wave I of (iii) decline.”
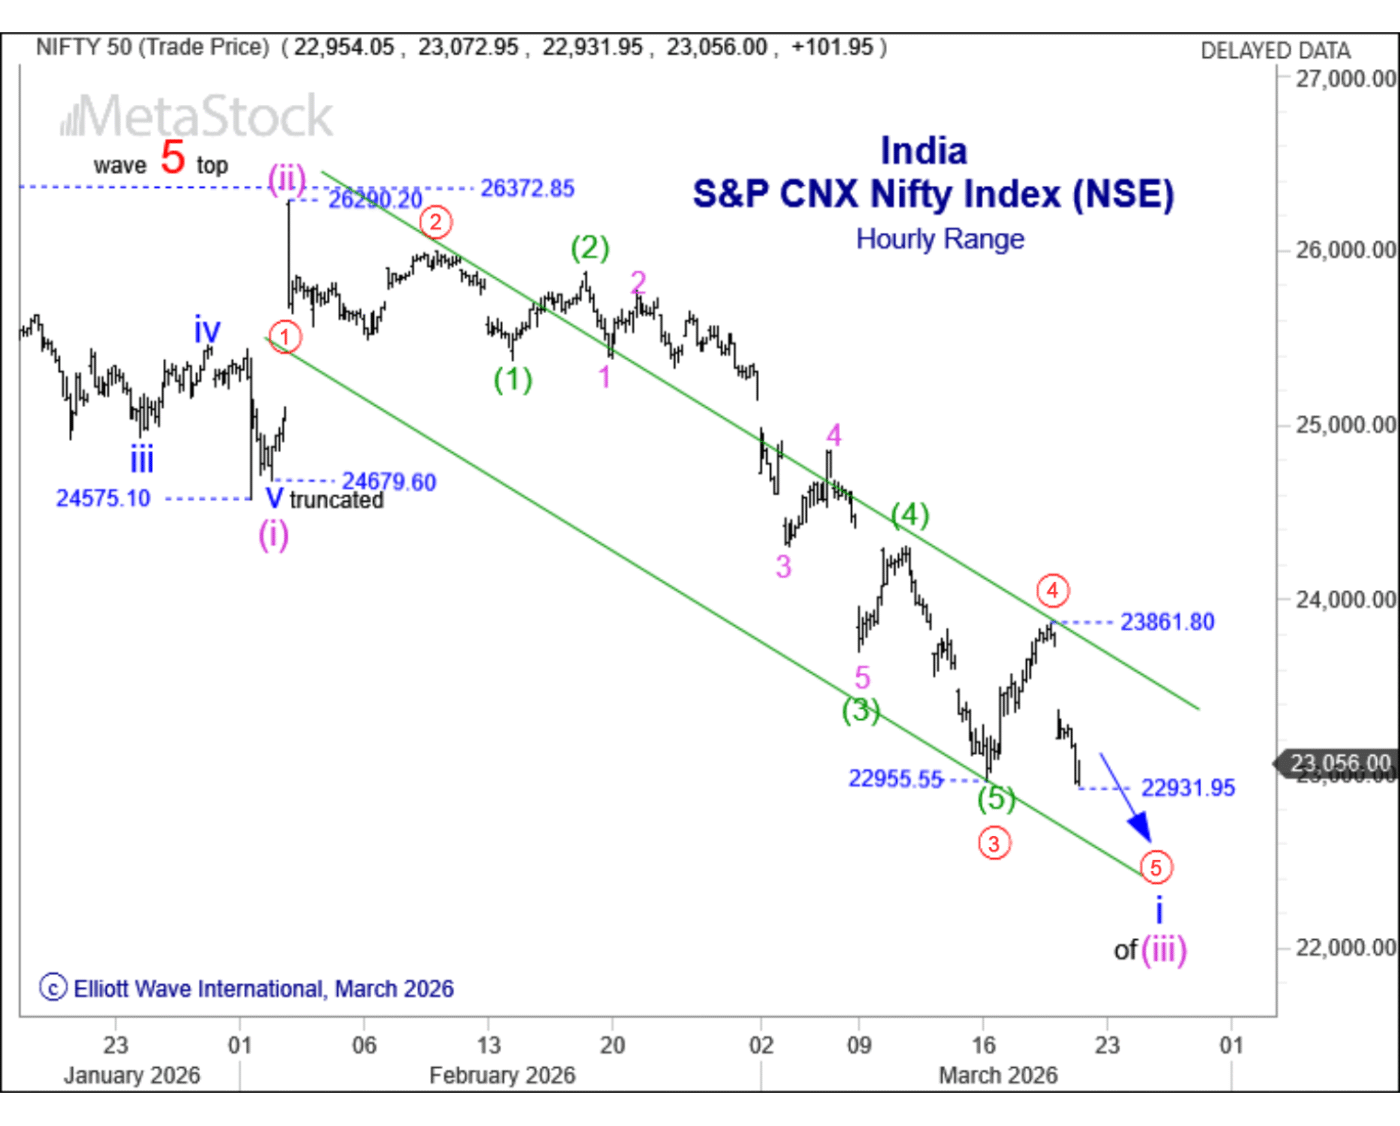
What happened next?
Just 12 days later (On March 30th) the Nifty Index would find the end of that series, concluding that impulsive wave 1 of (iii) decline:
Why This Matters
This wasn’t a one-time call.
It was continuous, real-time analysis:
- Identifying the setup early
- Monitoring confirmation levels
- Tracking each phase of the structure
- Updating expectations as new data unfolded
That’s the objective of Pro Services: Not just identifying opportunities — but following wave structures as they develop and updating subscribers along the way.
What are the waves saying now?
Stay aligned with the developing wave structure:
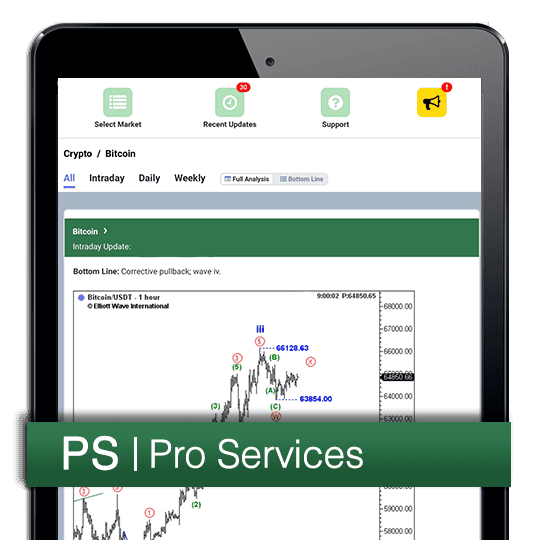
 Pro Services Intraday, Daily and Weekly Coverage
With Pro Services, you can get ongoing intraday, daily and weekly updates — including the intraday coverage of Asian-Pacific Stocks as seen in this article.
Or step back and track the bigger picture across global markets:
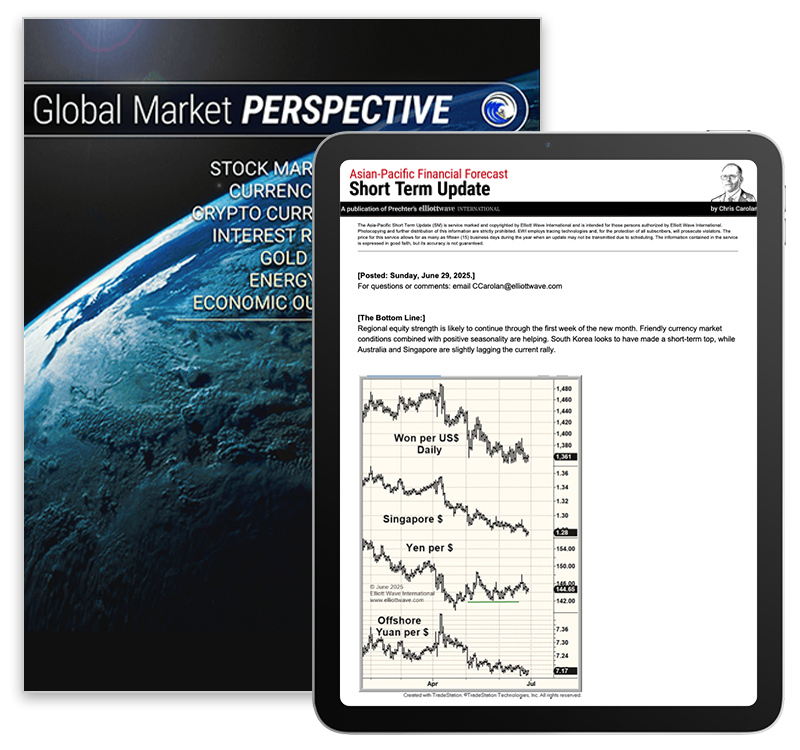
 Global Market Perspective Monthly & Short Term Coverage
Including Asian-Pacific markets, track major global trends, macro shifts and potential turning points monthly and/or short term with market updates 3x a week.
Only want to track the big picture analysis of India?
Check out our Asian-Pacific Financial Forecast Service India >>