The historic surge in U.S. Treasury yields stuns many strategists. But it was in the Elliott wave cards all along. Here’s why…
According to Google Trends, in the last seven days, online searches for the words “bond market” exceeded those for reality T.V. star “Kim Kardashian.”
The reason being: On October 4, 30-year U.S. Treasury yields soared above 5% for the first time since the 2007-2009 financial crisis. News of the move spread like wildfire as one by one, outlets ranked the 3-year long collapse in Treasury bonds as “among the worst market crashes in history.” (Markets Insider, Oct. 5)
For some, the road to getting here isn’t readily clear. Between October 2022 and this May, bond yields trended lower. They were about as flammable as an ice cube. Many investors and experts were lulled into a state of complacency that, perhaps, the worst of the bond bear market was over.
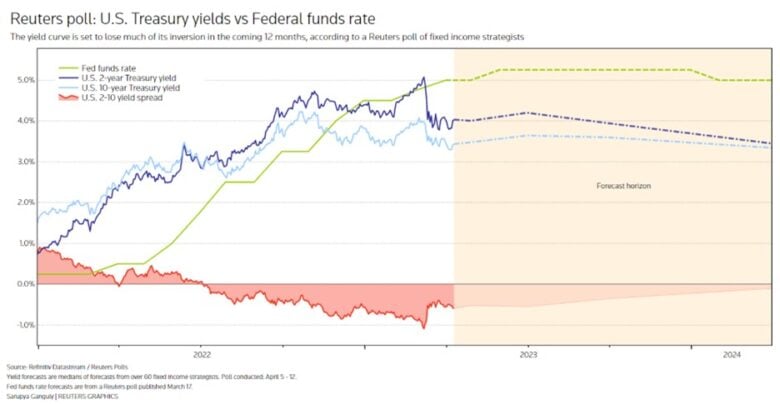
From Reuters on April 12:
“Strategists slash U.S. yield view again despite Fed’s inflation focus
“U.S. Treasury yields will trade sharply lower a year from now… The recent downward trend in yields is forecast to continue further, according to the April 5-12 poll of over 60 bond strategists.”
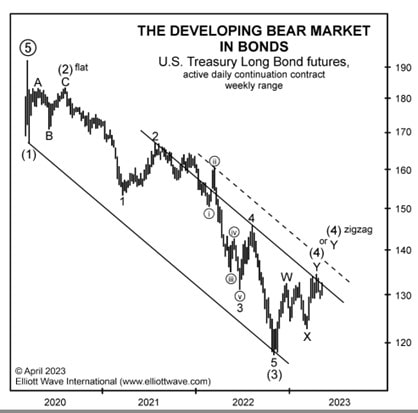
But, in the May 2023 Elliott Wave Financial Forecast, we showed this chart of U.S. Treasury Long Bond futures, which identified the 7-month long rise in rates (and fall in yields) as a fourth wave correction. The next move of consequence, therefore, would be the resumption of the bond bear market in a fifth wave decline (and a corresponding spike in yields). From the May Financial Forecast:
“Prices are tracing out a clear impulse from the March 2020 peak. Wave (4) is a countertrend rally that, when complete, will lead to wave (5) down to new lows. So far, prices carried to 134-14 on April 6, which has the potential to market the top of wave (4).
“Bonds will eventually decline to new lows, which means that long term U.S. Treasury rates will rise to new highs, exceeding 4.42%, the extreme of October 24, [2022].”
And, this next chart from the October 2023 Elliott Wave Financial Forecast brings the action in bonds forward. The precipitous decline in rates, and rise in yields, has taken the ideal, fifth-wave shape.
And the coincident rally in 30-year bond yields above 5% fulfills the May forecast for a “move to new highs.”
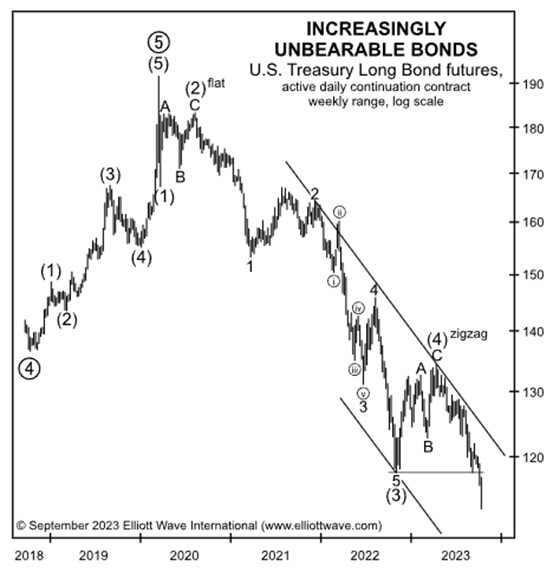
As to what’s next for bond yields, the Elliott wave model has a lot to say on that. If you’re familiar with the basic Elliott wave form, you are probably able to tell just by looking at the chart above which part of the price pattern should come next.
And if you need some help deciphering the waves, we’re happy to help: Our publications explain it all in great detail right now, starting with our flagship, October 2023 Elliott Wave Financial Forecast.
From Bond Market Turmoil to China’s Housing Bust, the Long View is Clear
From Morningstar on October 4: “Treasury market upheaval is rippling through global markets.”
Our May 2023 Elliott Wave Financial Forecast prepared investors for this upheaval long before it grew into the crisis we see today.
And now, the October 2023 Elliott Wave Financial Forecast reveals why the next meaningful move in bonds could initiate the “largest change” since the March 9, 2020 peak (in prices). Not to mention original insights into where China’s housing market, U.S. stocks, gold, the U.S. dollar, and more are headed in the months to come.
Risk-free, subscribe today and flip the script on your financial future.