From 12-year high to 9-month low to multi-month high… sugar swings have been unruly. But they weren’t unpredictable!
We all know commodities are the most volatile markets out there. The last two months in sugar prices put any doubt about that to rest, as the sweet soft has seen more wild mood swings than a five-year-old on Fruit Loops.
This kind of price fickleness is the reason the phrase “rage quit” was invented. But, for traders who understand the rules and guidelines of Elliott wave analysis, sugar’s rollercoaster ride followed a very clear, and predictable, path.
We begin at the starting point, when the seat bar is locked into place circa late last November. Then, sugar soared 40%-plus to a 12-year high. And, according to the mainstream experts, one “fundamental” event constituted a surefire silver bullet for sugar’s continued strength: a massive supply deficit.
From CNBC on November 17:
“Sugar in the global markets clearly have been on fire… and the strength comes on the fact that the markets are looking at deficit this time around. That promises to keep the sector in the positive for prices.”
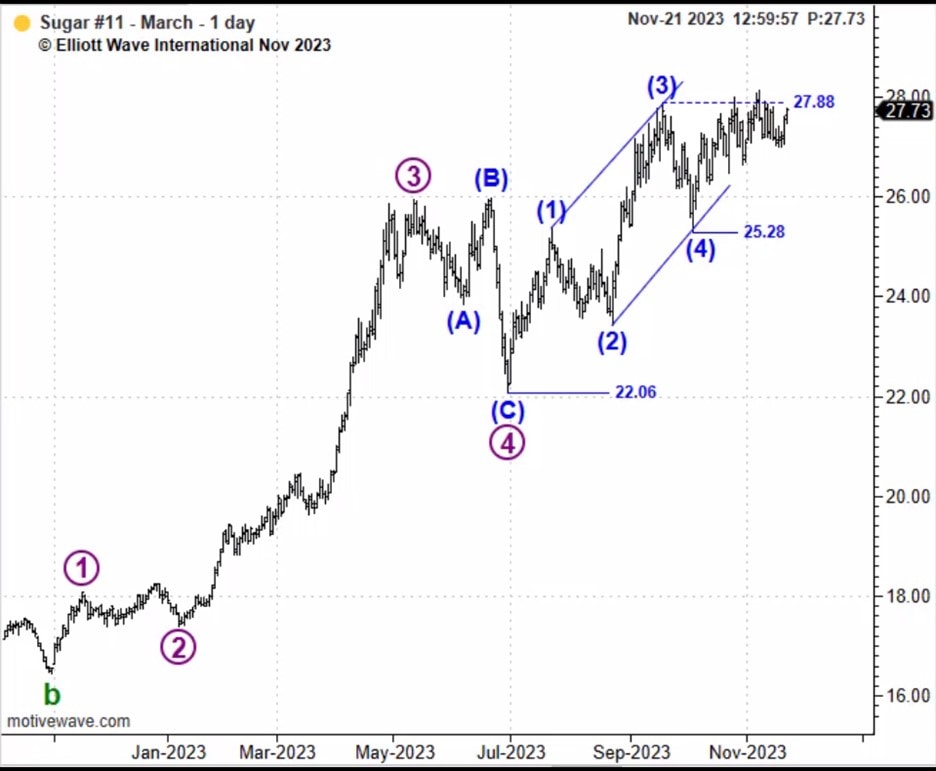
But, on November 21, our Commodity Pro Service daily video began to see a bearish Elliott wave set-up emerging on sugar’s price chart. There, editor Jim Martens observed that the rally since July had “satisfied minimum expectations” for a complete 5-wave impulse pattern, suggesting the upside was limited. From Commodity Pro Service on November 21:
“We can count wave 5 and the larger advance from 22.06 complete. What’s missing is an impulsive decline from the existing high at 28.14.”
From there, sugar prices began to weaken, albeit slowly. The labored decline put our immediate bearish count on alert. On November 30, Commodity Pro Service offered two possible wave counts. The first, a bullish scenario in which wave 5 was still underway.
Or the original, bearish wave count in which wave 5 was indeed complete. Commodity Pro Service explained that for this bearish scenario to be in effect, prices must fall beneath 25.28. If this occurred, “the end of the line” was in and a significant top was in place.
From there, sugar held nothing back on the downside, swiftly breaking through the 25.28 level on its way to 9-month lows on December 21.
CNBC that very day described the stomach-churning turn in sugar, writing:
“This year has been quite a rollercoaster for international markets, especially when it comes to sugar prices. After experiencing significant highs, prices are now undergoing a correction as we approach the end of the year.”
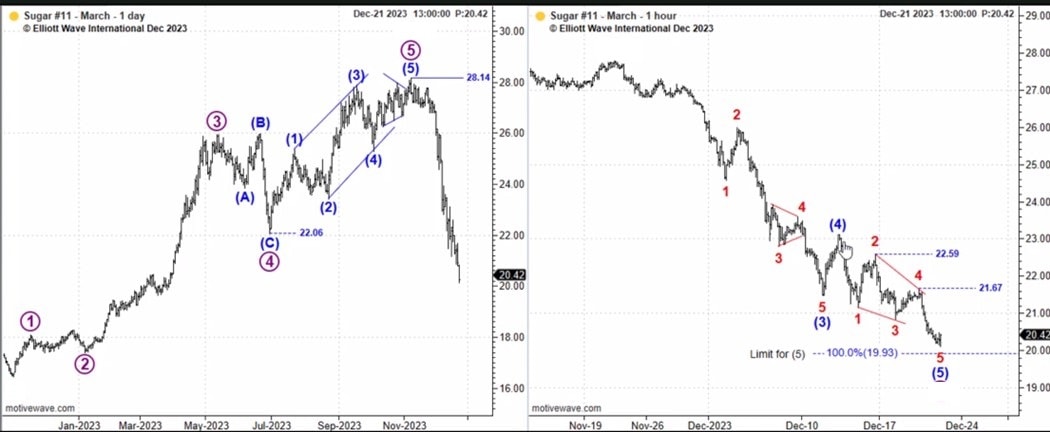
But our December 21 Commodity Pro Service daily video update presented a two-panel slide of sugar’s Elliott wave structure. Both the daily and hourly charts showed prices at a pivotal “line in the sand,” one that, if honored, would send sugar soaring once again. From Commodity Pro Service:
“The line then is 19.93, sugar can trade no lower than that. Notice how close the market has come to that line. If our count here is correct, we’re staring at a market that should reverse higher from here and stage the largest recovery that we’ve seen since early November.
“The 23 area being the upper end of the fourth wave of one lesser degree would probably be the minimum expectation. Usually, I like to see physical evidence before I say a market has changed trend. But for some, the proximity to that line in sand is an opportunity.”
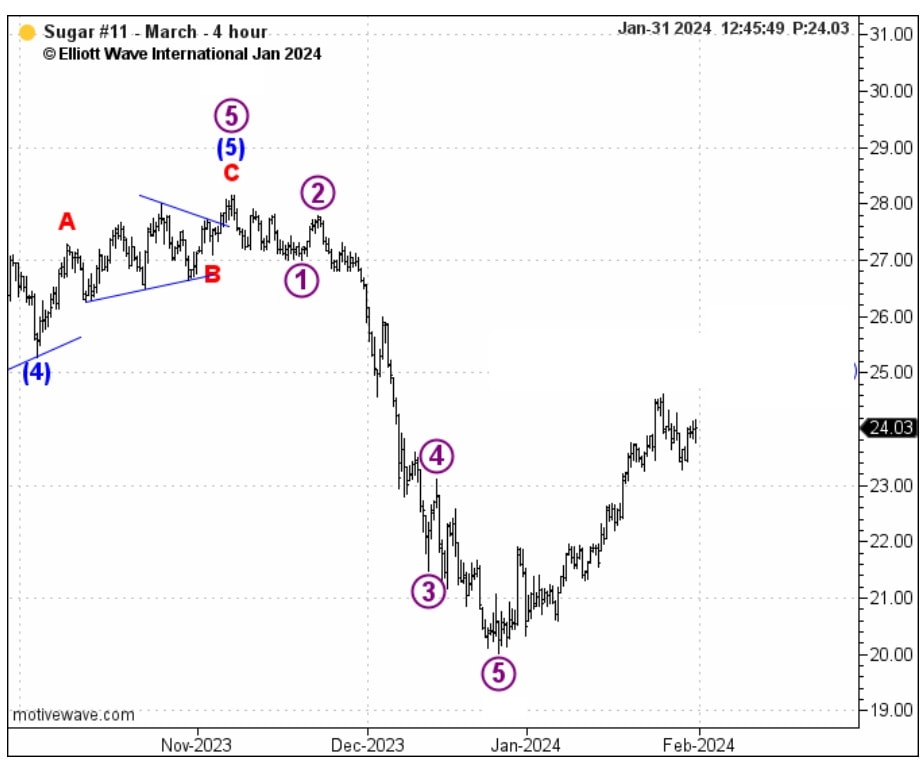
And once again, sugar prices followed their Elliott wave script and embarked on a powerful rally to multi-month highs. This chart from our January 31 Commodity Pro Service captures the extent of that bounce.
In the end, there’s no such thing as a perfect forecasting model. We’re no exception to that rule. But what Elliott wave analysis offers is an objective way to analyze commodity market trends in real time while defining critical price levels to minimize risk.
Commodity Opportunities are on Fire
When it comes to knowing the future of commodity prices, there’s no such thing as a silver bullet. Even the most jarring Black Swan events like that of the pandemic can’t accurately determine where prices will go.
The only confident measure of a market’s trend is investor psychology, which unfolds as Elliott wave patterns directly on price charts. Right now, our Commodity Pro Service presents high-confident outlooks for the world’s leading names in livestock, grains, softs, foods, and more.
See below to turn a new page in your investment future.