Topics:
Asian Markets (36) Commodities (32) Crypto (17) Currencies (24) Economy (105) Energy (15) ETFs (13) European Markets (50) Financial Forecast (1) Futures (1) Interest Rates (56) Investing (201) Metals (29) Short Term Update (1) Social Mood (79) Stocks (183) Trading (155) US Markets (110)
-
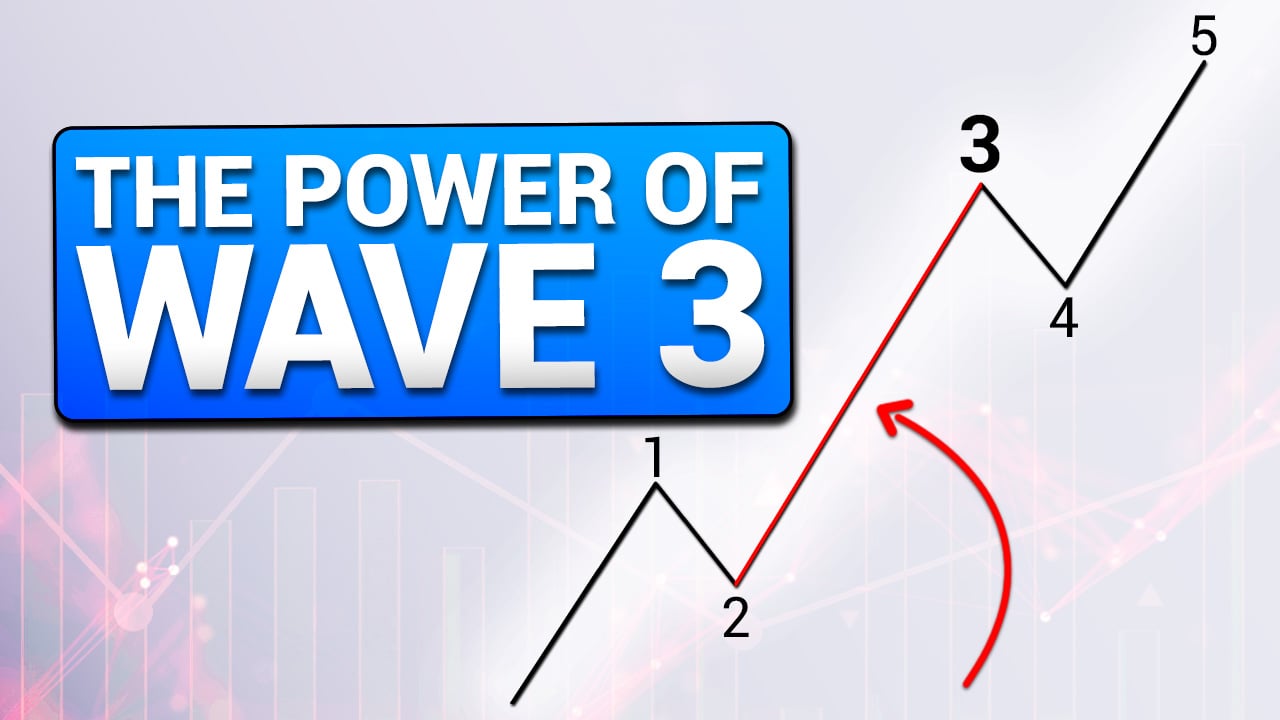
Third Waves Are the Ones You Want to Catch
-
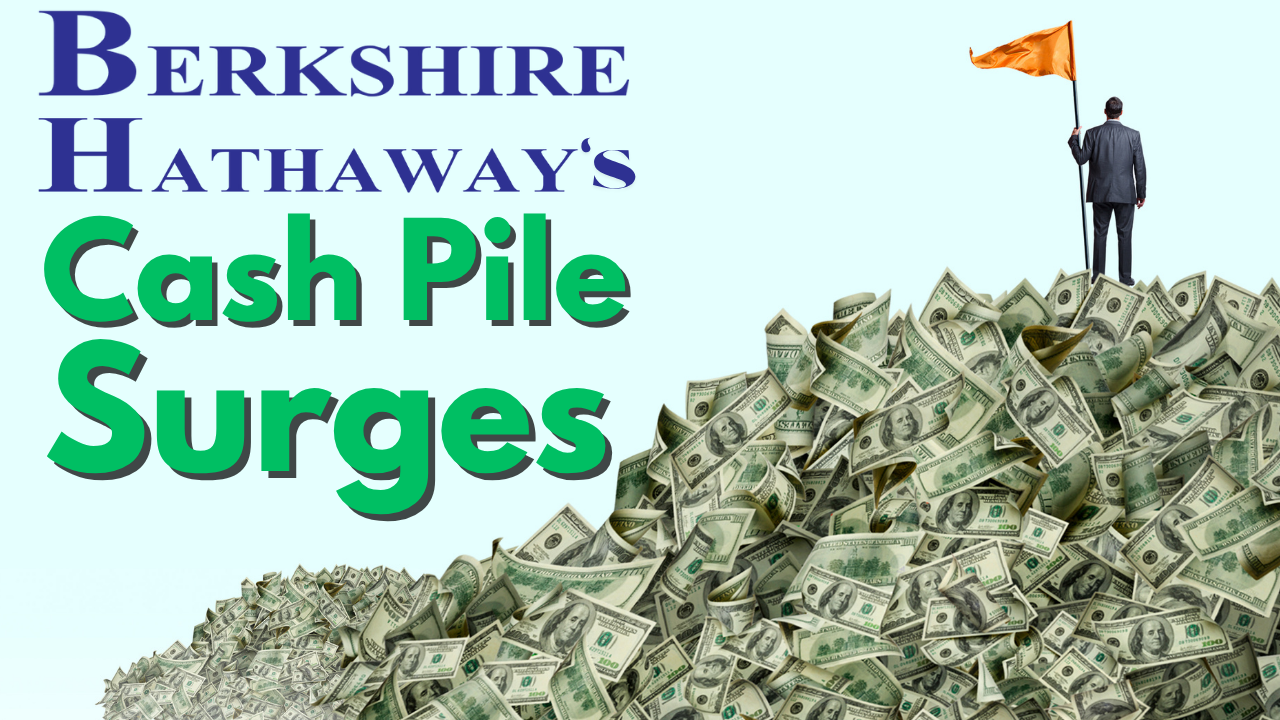
Retail Investors Vs. Warren Buffett
-
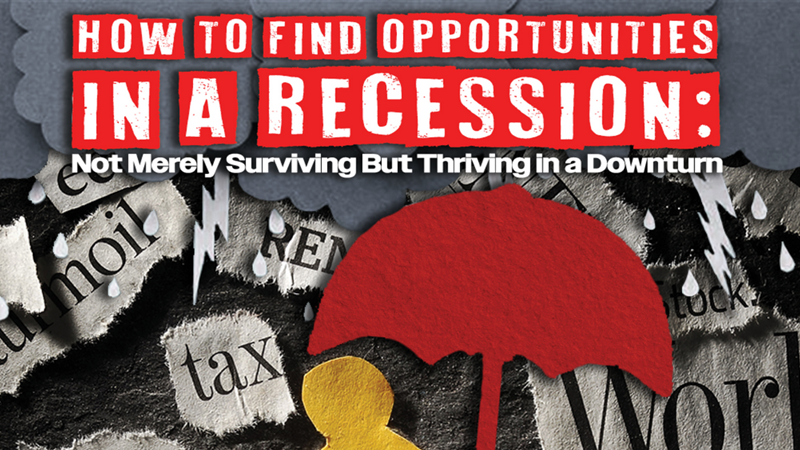
Preview: How to Find Opportunities in a Recession — Not Merely Surviving but Thriving in a Downturn
-

Corporate Executives Are Part of the Crowd
-

Houlihan Lokey (HLI): Riding the Trend with Flash and EWAVES
-
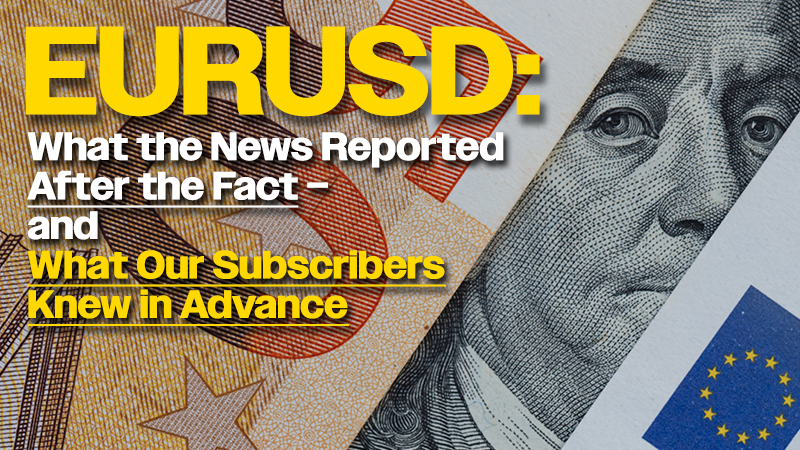
EURUSD: What the News Reported After the Fact — and What Our Subscribers Knew in Advance
-
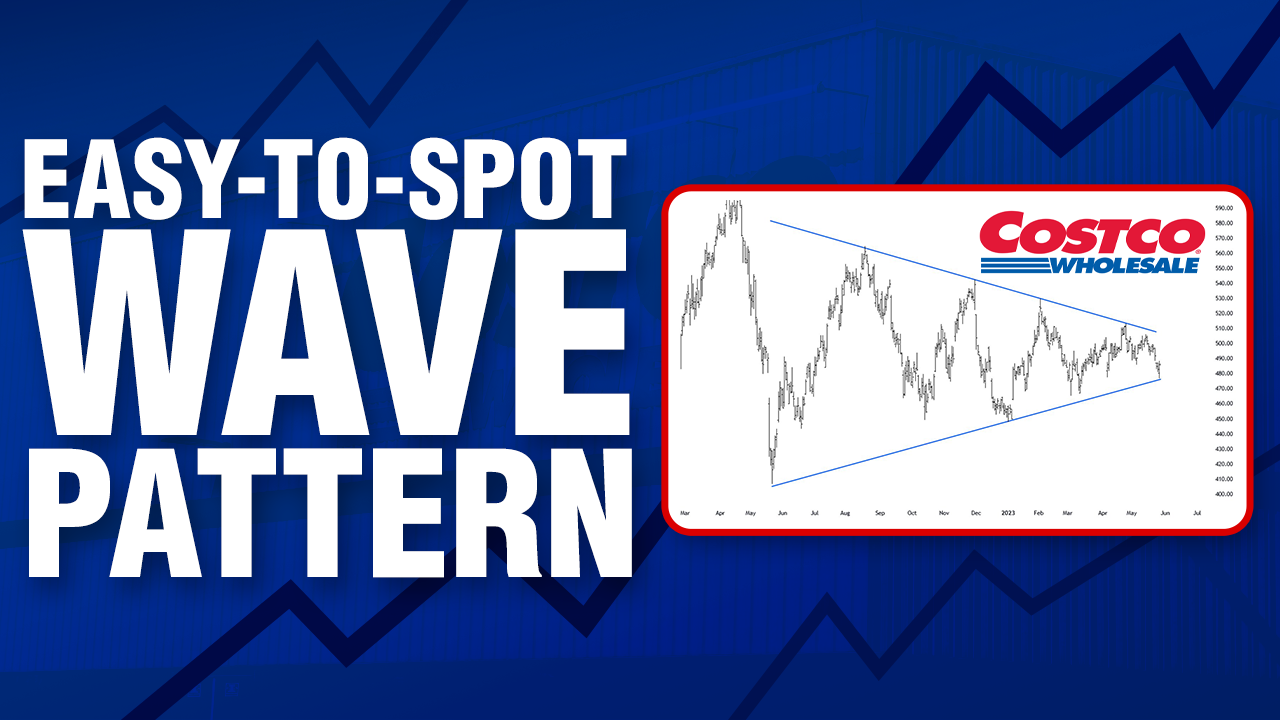
An Elliott Wave Setup You’ll See Again and Again
-
The Perils of Using Earnings to Forecast Stock Prices
-
Elliott Wave Case Study: India’s SENSEX
-

Pay Attention to Retail Investors’ Actions (Not Their Words)