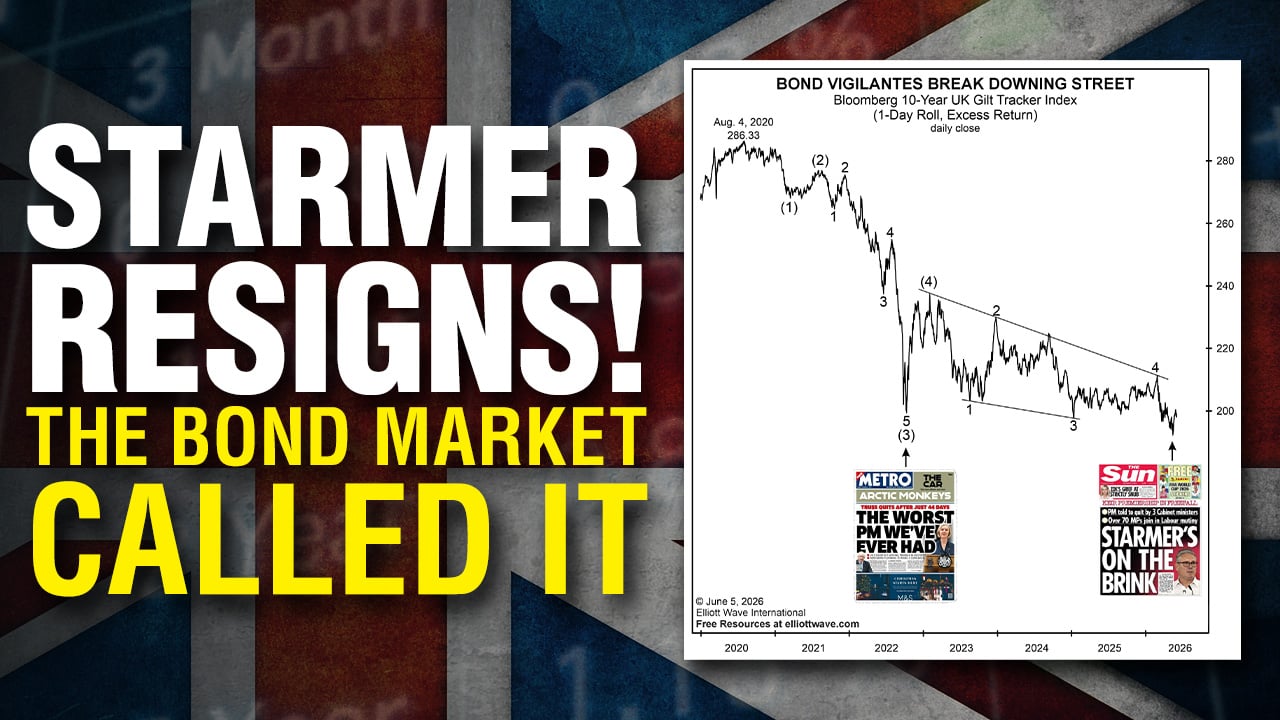
Here’s what happened the last time rates turned up from historically low levels
When someone mentions an investment for the “long-term,” a commentator will sometimes reply with that old rebuff: “Well, in the long-term, we’re all dead!”
Clever remarks aside, there can be value in considering the long-term, even the very long-term.
Let’s consider interest rates, which, as I’m sure you know, have already risen substantially over the past few years. This is a big topic on a lot of peoples’ minds as they consider borrowing money to buy a house, car or for another purpose. They’re wondering if they should take a loan out now or cross their fingers and wait with the hope that rates will reverse their upward trajectory.
This very long-term chart and commentary from our October Elliott Wave Theorist provide food for thought. Keep in mind that a rise in rates coincides with price declines in bonds:
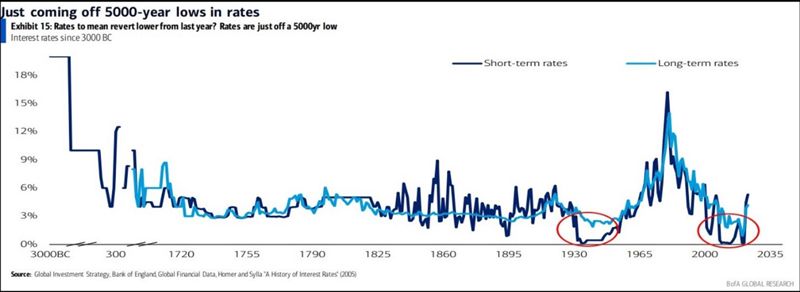
To understand how such a big decline [in long term bonds] was possible, it helps to gain perspective from the long term picture. Researchers at the Bank of England have put together this chart of short term and long term interest rates going back to the dawn of civilization. As you can see in [the chart,] the last time that rates turned up from historically low levels, they went up a lot.
Interestingly, relatively few observers seem to be concerned about the prospects for even higher interest rates. Here are a couple of recent headlines:
- Central banks look to have hit peak rates. (CNBC, Nov. 7)
- If Interest Rates Are Peaking, What Investments Are Likely to Do Best? (Wall Street Journal, Nov. 5)
Our independent analysis of interest rates (and bond yields) suggests that many people will be surprised by the extent of the current upward trend.
As a reminder, The Elliott Wave Theorist made this call back in October 2020:
Interest rates likely bottomed in March, which means bond prices have begun a significant fall.
That scenario has played out as the October 2020 Theorist anticipated.
Now is the time to get the details of our forecasts for bond yields (and interest rates) by following the link below.
Why the Monthly Elliott Wave Theorist
Has Been in Demand Since 1979
Yes, some financial newsletters get hot for a while. But, eventually, interest in them fades.
Not so in the 40-plus years The Elliott Wave Theorist has published. Every issue offers unique and highly useful insights into financial markets and cultural trends.
Elliott Wave International President Robert Prechter still writes every monthly issue himself. He covers all the relevant issues: stocks, bonds, credit, debt, inflation, deflation, politics, social trends and more.
The Elliott Wave Theorist is part of our Financial Forecast Service – which you can learn about as you follow the link below.