Back in late September and early October, the financial press was scrambling to explain gold’s price decline:
- Gold set for monthly fall on Fed rate outlook (CNBC, Sept. 29)
- Gold prices fall to six-month low. What’s bothering traders? (The Economic Times, Sept. 30)
- Gold extends fall as strong dollar, higher US rates take toll (Reuters, Oct. 2)
Gold continued its decline, and by Oct. 6, hit $1810.35.
On that very date, our U.S. Short Term Update said:
Trader sentiment is bearish and prices are setting up for a rally.
Indeed, $1810.35 turned out to be a low and gold did go on to rally.
On Dec. 4, gold hit a high of $2135.40.
As you’re probably aware, the price of the precious metal has since retreated, and some outlets are questioning whether gold has anymore “get up and go”:
- Gold’s rally has nearly run its course (Marketwatch, Dec. 4)
- Gold rally cools as dollar holds ground, US jobs data in focus (Reuters, Dec. 5)
- Gold prices fall on a firm dollar as spotlight moves to U.S. CPI data (CNBC, Dec. 11)
However, as we’ve learned, going along with the prevailing sentiment or even basing forecasts on so-called “fundamentals” have not always served investors well.
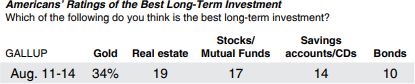
This not only applies to gold’s recent history, but going back some years as well, which we’ll briefly touch on. In this instance, in mid-August of 2011, gold had been in an uptrend for years and the prevailing sentiment was extremely bullish, as this news snippet of a Gallup poll showed:
Our September 2011 Elliott Wave Financial Forecast noted:
Perhaps the strongest sign of a gold top is a recent Gallup poll showing Americans now consider gold to be the best long term investment. Gallup parsed the survey by gender, age, income level and political affiliation and in every single subset, gold won out. … It is surely a sign of exhaustion.
Less than two weeks after that analysis published, gold hit a major top and then went into a multi-year decline.
Besides that Gallup poll, there were other sentiment readings which indicated extreme bullishness, and the Elliott wave model was also strongly suggesting an exhausted upward trend.
Returning to December 2023, learn about a key price level of gold that we’re keeping an eye on right now and why it’s important by following the link below.
Ever Heard About the 64-Year Long Bear Market?
In case you haven’t, this bear market stretched from 1720 to 1784.
Is that relevant now?
Yes. Because at the height of South Sea Company mania in 1720, most investors assumed ever-higher prices — not a lifetime-long bear market.
Some three hundred years later we’re in the waning days of 2023 … and yet again most investors assume ever higher prices.
Now, that doesn’t necessarily mean that another 64-year bear market is just ahead.
However, Elliott wave analysis does reveal a major high-confidence warning.
Get the details by following the link below.