The spiral of a galaxy. The structure of DNA. Even the creative peak of Picasso. All share something in common — the Fibonacci ratio.
The Fibonacci sequence starts with 0 and 1, and each subsequent number is the sum of the previous two: 0, 1, 1, 2, 3, 5, 8, 13, 21, 34, 55, 89, 144 and so on.
After the first several numbers in the sequence, the ratio of any number to the next higher is approximately .618 to 1 and to the next lower number approximately 1.618 to 1. The further along the sequence, the closer the ratio approaches phi, or the Golden Ratio.
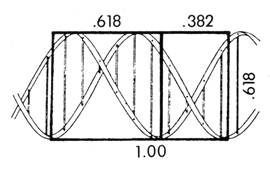
The illustration below shows how the DNA molecule spirals in Fibonacci proportion:
A 2014 Sunday Financial Times article noted that even human creativity may reflect the Fibonacci ratio. After analyzing 200 world-famous artists, researchers found that most created their best work just before two thirds — 0.6198 — of the way through life.
But what’s even more fascinating? Fibonacci ratios show up in financial markets, too.
In the early 20th century, market analyst Robert Rhea studied bull and bear markets from 1896 to 1932. He knew nothing of Fibonacci — but his results echoed it. To generalize his findings, the stock market on average advances by 1s and retreats by .618s.
We see Fibonacci ratios at work in the markets every day. And we use them — alongside Elliott waves — to forecast what’s likely next in stocks, gold, bonds and more.
See how we do it. Subscribe now.
Or, visit our educational resources page to learn more about Fibonacci and Elliott waves.