Fibonacci numbers follow a sequence that begins with 0 and 1, and each subsequent number is the sum of the previous two (0, 1, 1, 2, 3, 5, 8, 13, 21, 34, 55, 89 and so on).
After the first several numbers in the sequence, the ratio of any number to the next higher is approximately .618 to 1; its ratio to the next lower number is approximately 1.618 to 1. This is known as the Golden Ratio.
Fibonacci ratios appear everywhere in nature, from the shape of galaxies and seashells to molecules and the human body. And remarkably, they also show up in the movement of stock prices.
Long- and short-term market charts are often filled with Fibonacci relationships. Here’s an example from history, which shows the Dow Industrials from 1930 through 1941:
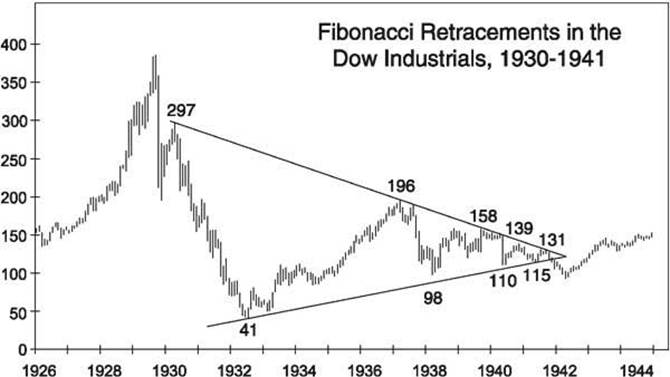
The market swings cover approximately 260, 160, 100, 60, and 38 points respectively, closely resembling the declining list of Fibonacci ratios: 2.618, 1.618, 1.00, .618 and .382.
Here’s another historical example. The chart below shows how an extended wave 5 in soybeans in 1973 related by 1.618 to waves 1 through 3. A good generalization of a normal relationship is that wave 5, when measured from the span of wave 4, will end when it reaches 1.618 times the length of waves 1 through 3:
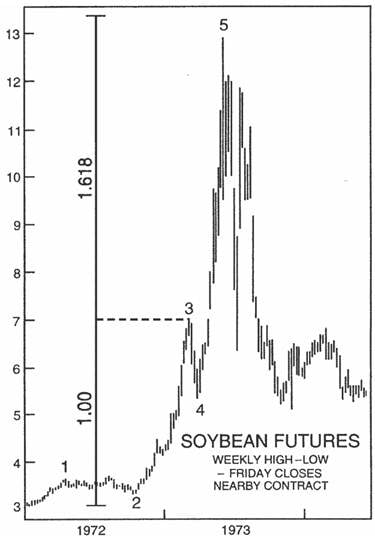
You can see how far – and how fast – the price of soybean futures plummeted after the completion of wave 5. Fibonacci ratios can also help to identify powerful moves to the upside.
Want to see how we apply these insights today?
Subscribe now to discover how we’re using Fibonacci and Elliott waves to forecast major financial markets.
Or, visit our educational resources page to learn more about Fibo and the waves.