COST soars to record highs in December. The key to understanding why is directly on its stock price chart, not inflation or consumer spending.
On October 22, Fox Business published a story titled “Costco Shopper Says He Cracked the Secret to Wholesaler’s Price Tags.” From the story:
TikTok user @butthatsmyopinon posted a DaVinci code-like list of secret “patterns in Costco pricing” leading to huge savings, such as:
“Price tags with an asterisk serve as a notice for discontinued items, which are priced very low in hopes of selling them quickly.
“Prices ending in ‘.49’ and ‘.79’ have the same meaning — a manufacturer special offer… usually cheaper than the retail price.”
“Items that end in a ‘.00’ are believed to be low in stock; the managerial team is trying to get these items off the shelf.”
The post quickly went viral with millions of shares and likes. (Excluding Costco sales managers!)
As for investors “shopping” for money-gaining deals in stocks, mainstream analysts insist they too have cracked the pricing code; namely, “market fundamentals” ending on a positive note cause price rallies while those ending on a negative note trigger sell-offs.
The problem is “fundamental” news stories are more jam-packed than a Costco parking lot the week before Christmas. There’s no way to sus through them and find a clear outlook for individual stocks. Take, for example, these October news stories on Costco’s Nasdaq-listed stock COST:
- Bearish: “This Costco Insider Just Sold 1,200 Shares of COST stock” – Oct 12 Investopedia
- Bullish-ish: “It might come as a surprise that legendary investor Warren Buffett doesn’t own Costco shares. No matter if the Oracle of Omaha owns it or not, it’s obvious that this is a wonderful company.” — Oct. 18 Motley Fool
- Bearish: Costco is named one of “3 Stocks that are At Their Peak and Ready to Fall… The valuation is simply too high given the economy’s weakening trajectory.” — Oct. 23 Investor’s Place
In truth, there are discernable patterns to price trends; just not in the form of “market fundamentals.” Investor psychology, which unfolds in objective Elliott wave patterns directly on market price charts, is the main driver of trends.
And, once you see these patterns unfold, much like @butthatsmyopinion, you can’t unsee them. They’ll translate into potential high-confidence opportunities in all liquid markets like COST.
Our Trader’s Classroom analysis of the stock on October 18presented the following Elliott wave interpretation of COST, which called for a forthcoming third-wave advance.
From our October 18 Trader’s Classroom:
“Here is Costco Wholesale. This thing could really start to take off in wave 3 of 5. New highs are within reach. As long as that low holds at 530.56, this counts in good shape.”
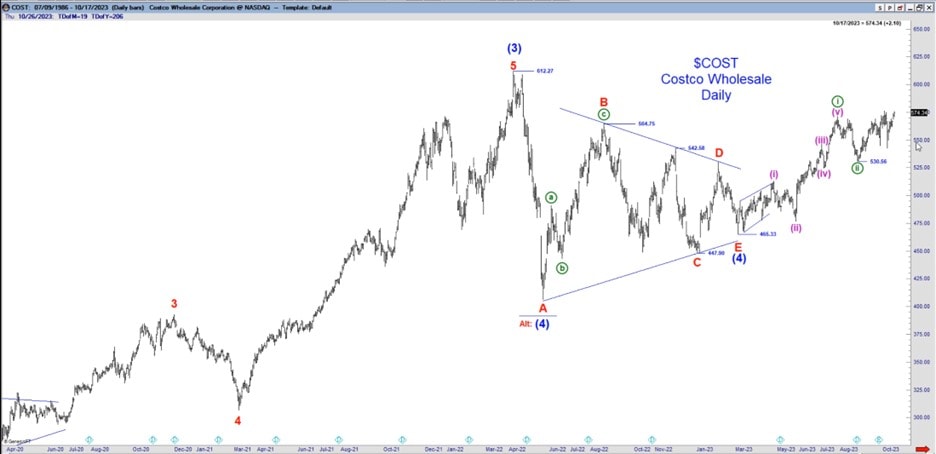
But COST wasn’t yet ready to spike. Prices lumbered higher but not as strongly as its Elliott wave count anticipated.
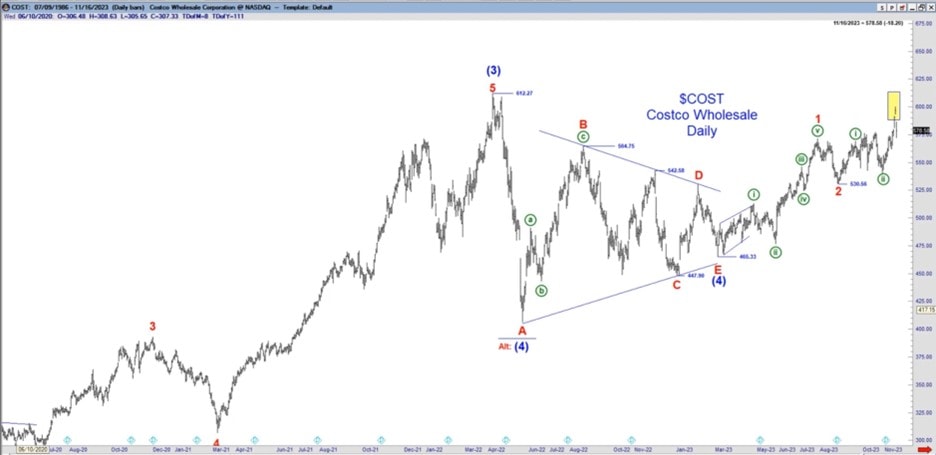
On November 17, Trader’s Classroom revisited COST. A 1-2 bullish wave series had developed, and now the stage was indeed properly set for the third-wave move to new highs.
From the November 17 Trader’s Classroom:
“Bottom line is that as long as that last low holds, 540.23, then this count will be valid and on track and Costco should move higher.”
Notice that neither update even mentioned anything related to “market fundamentals,” only the patterns of market psychology.
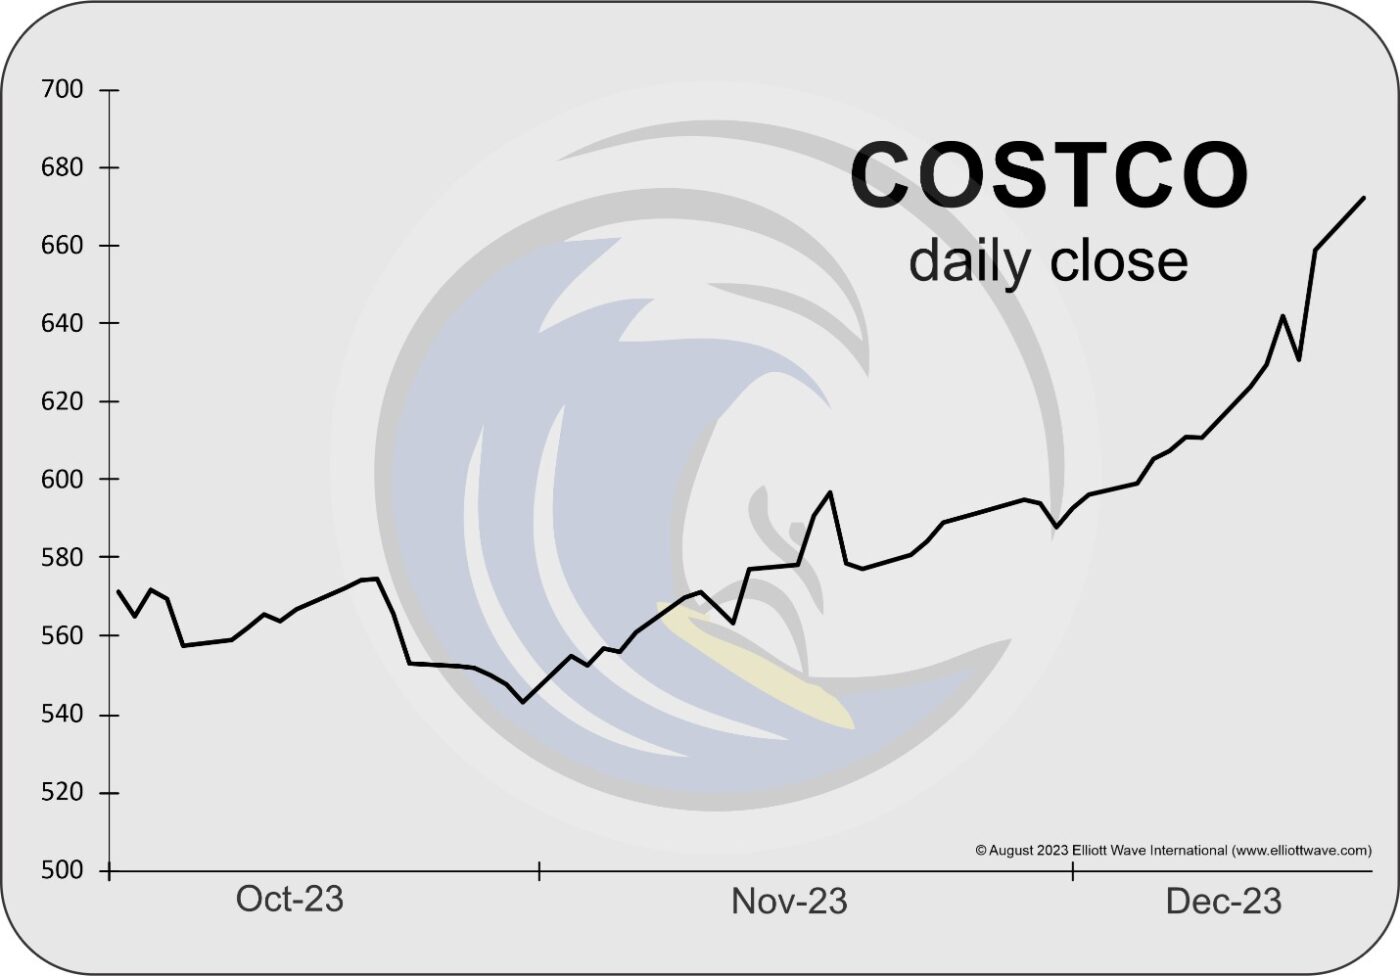
And, this next chart captures the extent of COST’s rally to record highs into December.
From CNBC on December 14:
“Wall Street thinks Costco’s record-high stock can go higher. We agree and see catalysts coming.”
Well, if COST is headed higher, those catalysts won’t be seen coming from the “fundamental” backdrop but rather on the foreground of COST’s price chart as Elliott wave patterns.
The same goes for any liquid market, anywhere in the world, on any time frame.
Align Yourself with High-Confident Opportunities
Apple, Amazon, Bitcoin, CSX Corporation, and more — what do they all have in common?
Answer: They’ve all been featured in the recent Trader’s Classroom videos. In each one of these carefully crafted lessons, editor Robert Kelley walks you through trading tips — and also new opportunities, whenever they present themselves. You get everything: from wave count to confirming price action and the critical levels necessary to stay on the right side of risk.
Watch new lessons now — see below for more.