Amazon stock surges to all-time highs on March 28. The road to reaching this milestone was paved in earnings – or was it?
On March 28, Motley Fool poured lighter fluid on the growing fervor surrounding retail giant Amazon: “Alphabet and Amazon Stocks Surge to All-Time Highs: Buy These “Magnificent Seven” Stars Now or Regret It Later.”
In one fail swoop, Amazon went toe-to-toe with the world’s third-largest tech company, was called a star, and made the subject of a classic fear-of-missing-out campaign.
The why is clear: Amazon stock soared to all-time high territory on March 28.
But how Amazon stock made it there is unclear. Investor’s Business Daily tried filling in the blanks on March 27:
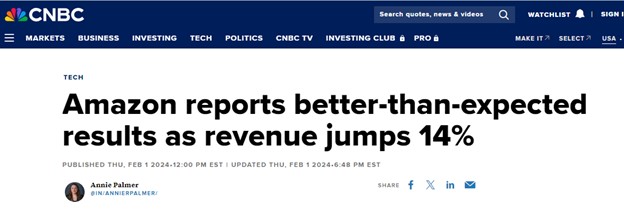
“Nearing all-time highs. Amazon.com (AMZN) has started strong out of the gate in 2024, with a recent earnings report that sent its stock soaring.”
The earnings report cited was released on February 1, covered here by CNBC:
But the fact is, AMZN didn’t start strong out of the gate in 2024. It started strong at the end of October, months before the bullish, fourth-quarter earnings report put the wind in the stock’s sails. Around that time, on October 18, our Trader’s Classroomvideo lesson used Amazon as an example for its wave-counting exercise. There, editor Robert Kelley presented this labeled chart of AMZN and walked subscribers through the most high-confident wave interpretation.
From the October 18 Trader’s Classroom:
“It looks like it’s a big wave 4 down, looking for a move back up to new highs. That’s a pretty long-term move. Wave 3 is done. It’s debatable if wave 4 is done. So far it’s a 3-wave rally. This low is important at 123.04. If it takes that out, you could be looking for another wave down [below 120]” before taking off to the upside.
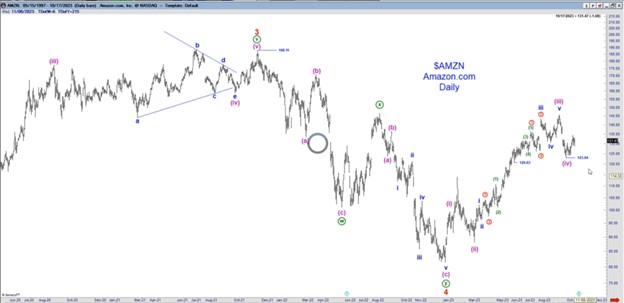
From there, AMZN did fall below the 123.04 level, bottoming at 119 on October 26. And, from there, the stock said sayonara to selloff.
On March 7, Trader’s Classroomrevisited the megacap to update the Elliott wave count in play. From the March 7 lesson:
“You should see a series of fourth and fifth waves on the upside before you see a significant top. The 165 area should act as support and I would expect it to ratchet higher going forward.”
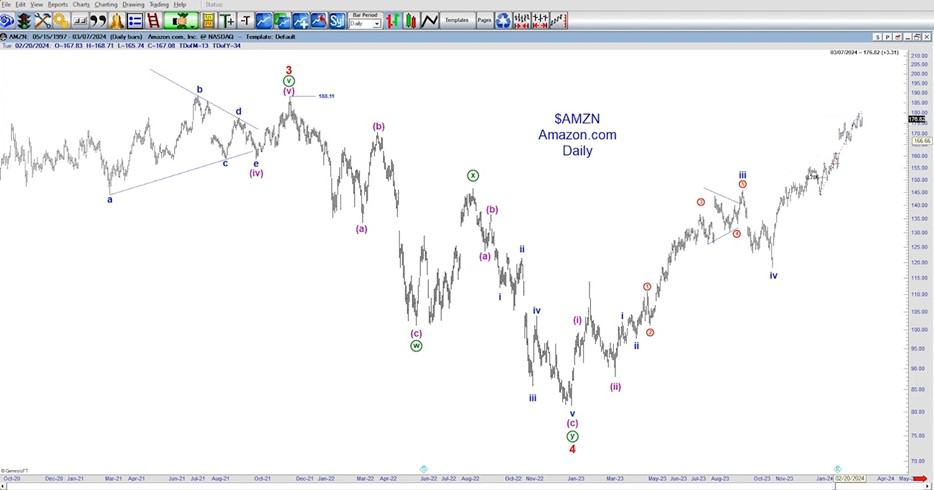
Here, AMZN respected the 165 support and followed its Elliott wave script to “ratchet on higher,” reaching the all-time area glamorized by Motley Fool, March 28.
Every investor and trader has known regret. It’s natural and unavoidable. The best case is identifying potential set-ups early, and heeding exit points before it’s too late. Elliott wave analysis assists both efforts, by presenting clear support and resistance levels to minimize risk.
Trader’s Classroom will be first on the scene with any new opportunities in Amazon, as they arise. Until then, the newly released Trader’s Classroom video lessons feature limited-time, and long-term outlooks in Bitcoin, coffee, the Euro/US Dollar, cotton, and more.
Trading Lessons (Plus, Market Opportunities): 2 for 1
3 times a week, press “Play” and watch one of our 6 experienced analysts explain in comprehensive detail how to recognize the relevant Elliott wave patterns (and supporting technical indicators) underway now and in the future.
This is every Trader’s Classroom video in a nutshell: a lesson, often with a new opportunity in a wide swath of markets from individual stocks, cryptocurrencies, commodities, and more.
Here’s how to watch the latest lessons now.