In late October, the Israel-Hamas war stoked bullish oil forecasts. But a bearish Elliott wave pattern warned a downturn was due. The story continues.
October began with one of the deadliest terrorist attacks of the 21st century – the horrific October 7 Hamas raid of Israel. The ensuing events quickly escalated into outright war, and what The Guardian on October 13 called “the worst humanitarian crisis the region has experienced since 1948.”
As one of the planet’s central energy-producing regions, the Middle East powder keg prompted an immediate spike in oil prices AND mainstream financial pundits to prep oil’s upside. These headlines from the time recall:
- “Oil’s 10% Rally Has Traders Flocking to Buy Up Bullish Options… as risks mount of an escalation in the war between Israel and Hamas that could drive crude higher.” — October 20 Bloomberg
- “Oil Prices Forecast: Crude Climbs Amid Geopolitics, Dwindling U.S. Inventory.” — October 21 FX Empire
- “Israel-Hamas war sends oil prices as high as $96 per barrel, IEA head says it’s ‘definitely not good news’ for the market. Markets will remain volatile, and the conflict could push oil prices higher.” — October 20 Fortune
- “Many worry an escalation of tensions in the region could drive oil prices far higher by choking a key transit route for seaborne cargoes of oil and gas from the Middle East to the global market.” — October 20 The Guardian
From a “market fundamentals” perspective, a crippling war in an energy mecca is as bullish as it gets. Oil’s path of least resistance seemed up.
But from an Elliott wave perspective, oil’s knee-jerk surge following the war was just that: a temporary blip that would be reversed by a bearish technical set up.
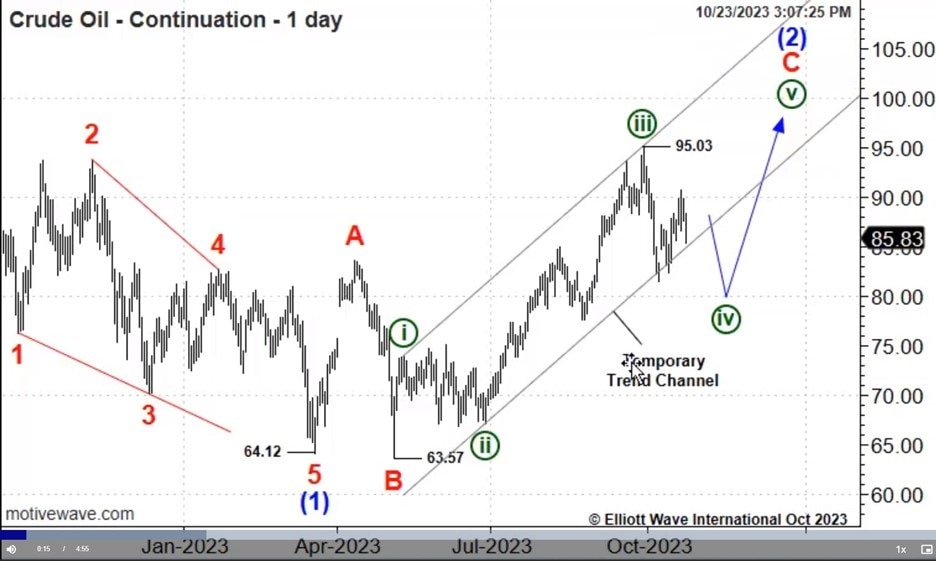
On October 23, our Energy Pro Service showed this chart of crude oil, which placed prices at the start of a wave 4 decline which began at the September 27 peak. From Energy Pro Service:
“We’re entering into this decline. When you look at it from a continuation perspective. Look for five-distinct legs down.
“From little if any above the 90.78 Friday high looking for price to assault 8150 support in five waves. Price falling below 86.60 over the next several days will bolster this potential Bear view.”

From there, oil accelerated lower. But, the pace and depth of the decline looked suspiciously deep for a fourth wave correction. Something even more bearish was likely underway.
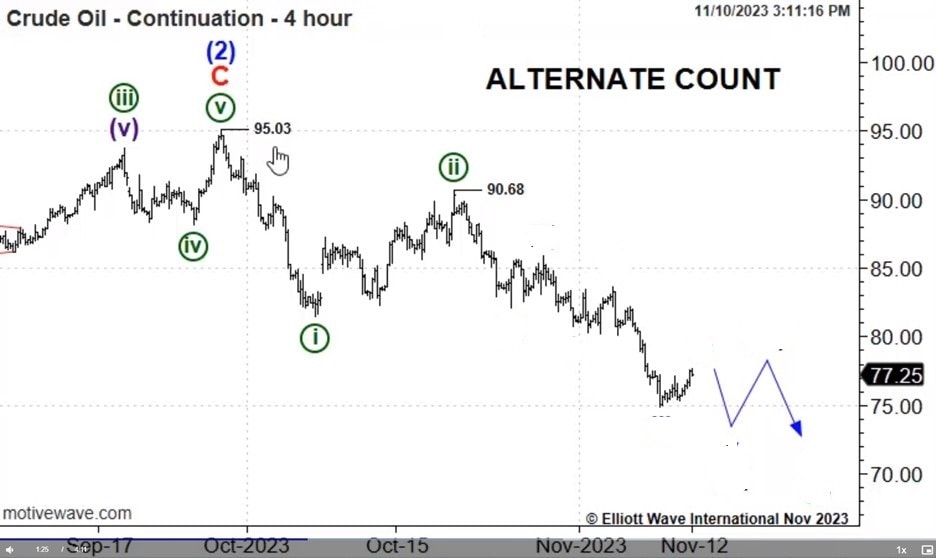
On November 10, our Energy Pro Service introduced an alternate interpretation which posited the larger, wave 2 peak was already in place. This meant the decline had more bearish potential. This was now a larger-degree third wave decline:
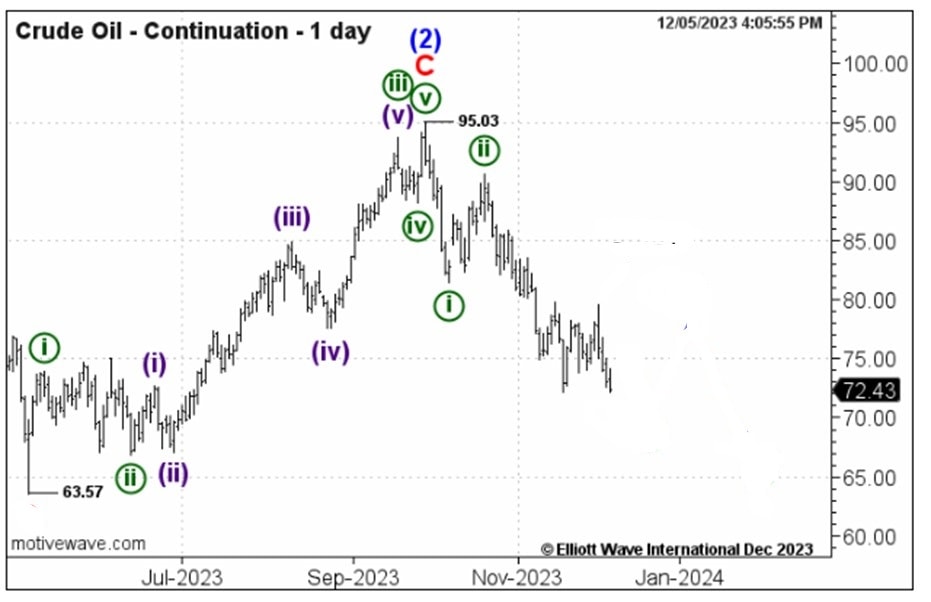
“This [initial bearish wave] count is in serious jeopardy. Here’s the alternate count. It labels intermediate wave 2 complete at the 95.03 continuation rebound high. From there, the subdivisions are the same. We’re working on wave 3 decline.”

And, further crude did decline, hitting a 5-month low on December 6.

At day’s end, the effect of “fundamentals” on prices will be temporary at best. Elliott wave analysis, however, places price action in an objective context, and presents critical levels to help traders and investors manage risk as the pattern becomes clearer.
Energy Opportunities on Every Time Frame
For active traders watching the intraday, daily and weekly price movements in the energy markets, our Energy Pro Service presents detailed analysis that focus on meaningful developments underway in crude oil, natural gas, heating oil, unleaded and more.
Energy Pro Service helps you to shift from simply following market trends to predicting their objective paths of least resistance (and risk).
