Every day, forecasters make predictions based on the same old tools: economic fundamentals, valuation models, polls and so on. And every day, many of those predictions miss—sometimes spectacularly. The point isn’t that traditional analysts aren’t well-educated; it’s that just MAYBE what they learned is wrong. When the same methods keep producing “misses,” “unexpecteds,” and “surprises,” it’s fair to wonder whether there’s a better way to understand markets, politics and social trends. Elliott Wave International has spent decades exploring exactly that possibility.
Many financial market observers believe that rising oil prices are bearish for stocks, and vice versa.
The headlines back in February 2011 said exactly that:
“Stocks slide for a third day on worries about oil.” — Associated Press.
“Stocks Struggle, Oil Surges Amid Libyan Violence.” — ABC News.
But the facts told a different story: Since the first quarter of 2009, oil had tripled in price while stocks had doubled!
Here’s a chart we published on February 25, 2011.
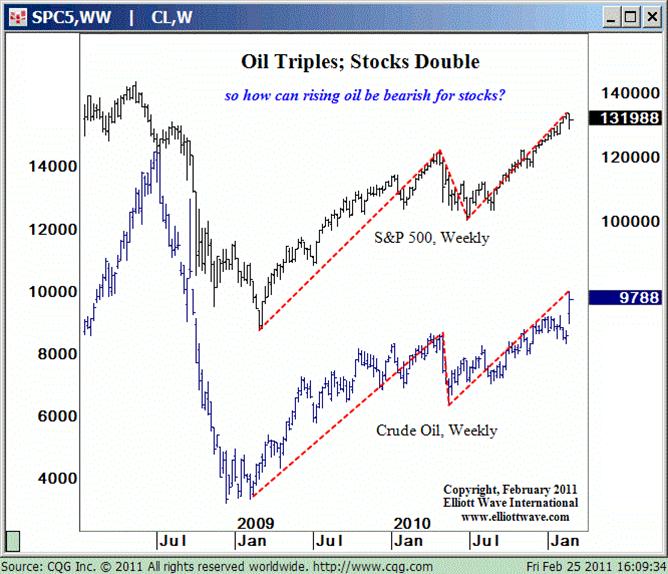
If rising oil is bearish for stocks, the S&P 500 index should have declined persistently. Instead, it rallied.
Yet sometimes stocks and oil go in opposite directions. We have seen that happen, too.
The point is: Their price trends are not reliably correlated.
To win, you have to analyze financial markets individually, on their own merits. That is what we do.
Want to see more myths get debunked? Read Chapters 1 and 2 of The Socionomic Theory of Finance – FREE.
Ready for forecasts based on insight—not assumptions? Subscribe now and get our current market analysis.