Elliott Wave Theory:
Introduction to the Wave Principle
Here’s a brief introduction to the Elliott Wave Principle: from its origins to how it differs from fundamental analysis. Enjoy!
Where Did Elliott Wave Theory Come From?
Ralph Nelson Elliott is the father of the Elliott wave theory, which is commonly called and more accurately described as the Elliott Wave Principle. Born on July 28, 1871 in Marysville, Kansas, Elliott reached his ultimate achievement late in life by a circuitous route.
After a long career in various accounting and business practices, R.N. Elliott was forced into an unwanted retirement at the age of 58 due to an illness contracted while living in Central America. Needing something to occupy his mind while recuperating, he turned his full attention to studying the behavior of the stock market.
Elliott examined yearly, monthly, weekly, daily, hourly and half-hourly charts of the various indexes covering 75 years of stock market behavior. By November 1934, R.N. Elliott’s confidence in his ideas of what is sometimes called the Wave Theory had developed to the point that he presented them to Charles J. Collins of Investment Counsel, Inc. in Detroit.
Collins had traditionally put off the numerous correspondents who offered him systems for beating the market. Not surprisingly, the vast majority of these systems proved to be dismal failures. Elliott’s Wave Theory, however, was another story.
The Dow Jones averages had declined throughout early 1935, and advisors were turning negative with the memories of the 1929-32 crash fresh in their minds. On Wednesday, March 13, 1935, just after the close of trading — with the Dow Jones averages finishing near the lows for the day — Elliott, citing his Wave Theory analysis, sent a telegram to Collins and flatly stated:
“NOTWITHSTANDING BEARISH (DOW) IMPLICATIONS ALL AVERAGES ARE MAKING FINAL BOTTOM.”
The next day, Thursday, March 14, 1935, was the day of the closing low for the Dow Industrials that year. The 13-month “correction” was over, and the market immediately turned to the upside. Two months later, as the market continued its upward climb, Collins agreed to collaborate on a book on the Wave Theory. The Wave Principle was published on August 31, 1938.
During the early 1940s, the Wave Theory continued to develop. Elliott tied the patterns of collective human behavior to the Fibonacci, or “golden” ratio, a mathematical phenomenon known for millennia as one of nature’s ubiquitous laws of form and progress.
Elliott then put together what he considered his definitive work, Nature’s Law — The Secret of the Universe. This volume includes almost every thought he had concerning his Wave Theory.
As a result of Elliott’s pioneering research, today, thousands of institutional portfolio managers, traders and private investors use the Wave Theory in their investment decision-making.
What is the Elliott Wave Principle?
The Elliott Wave Principle is a detailed description of how groups of people behave. It reveals that mass psychology swings from pessimism to optimism and back in a natural sequence, creating specific and measurable patterns.
One of the easiest places to see the Elliott Wave Principle at work is in the financial markets, where changing investor psychology is recorded in the form of price movements. If you can identify repeating patterns in prices, and figure out where we are in those repeating patterns today, you can predict where we are going.
The Elliott Wave Principle is named for its discoverer, Ralph Nelson Elliott.
The Elliott Wave Principle measures investor psychology, which is the real engine behind the stock markets. When people are optimistic about the future of a given issue, they bid the price up.
Two observations will help you grasp this: First, for hundreds of years, investors have noticed that events external to the stock markets seem to have no consistent effect on their progress. The same news that today seems to drive the markets up are as likely to drive them down tomorrow. The only reasonable conclusion is that the markets simply do not react consistently to outside events. Second, when you study historical charts, you see that the markets continuously unfold in waves.
Using the Elliott Wave Principle is an exercise in probability. An Elliottician is someone who is able to identify the markets’ structure and anticipate the most likely next move based on our position within those structures. By knowing the wave patterns, you’ll know what the markets are likely to do next and (sometimes most importantly) what they will not do next. By using the Elliott Wave Principle, you identify the highest probable moves with the least risk.
How Can I Apply the Elliott Wave Principle?
How Can I Begin Applying the Elliott Wave Principle?
When investors first discover the Elliott Wave Principle, they’re often most impressed by its ability to predict where a market will head next.
And it is impressive. But its real power doesn’t end there. The Elliott Wave Principle also gives you a method for identifying at what points a market is most likely to turn. And that, in turn, gives you guidance as to where you might enter and exit positions for the highest probability of success.
So, how do you begin applying the Elliott Wave Principle? By starting at its most basic level. The Elliott Wave Principle works by identifying patterns in market prices. So, in other words, we start by analyzing waves on a chart.
Elliott’s pattern consists of “impulsive waves” and “corrective waves.” An impulsive wave is composed of five subwaves. It moves in the same direction as the trend of the next larger size. A corrective wave is divided into three subwaves. It moves against the trend of the next larger size.
As the figure below shows, these basic patterns build to form five and three-wave structures of increasingly larger size (larger “degree,” as Elliott said).
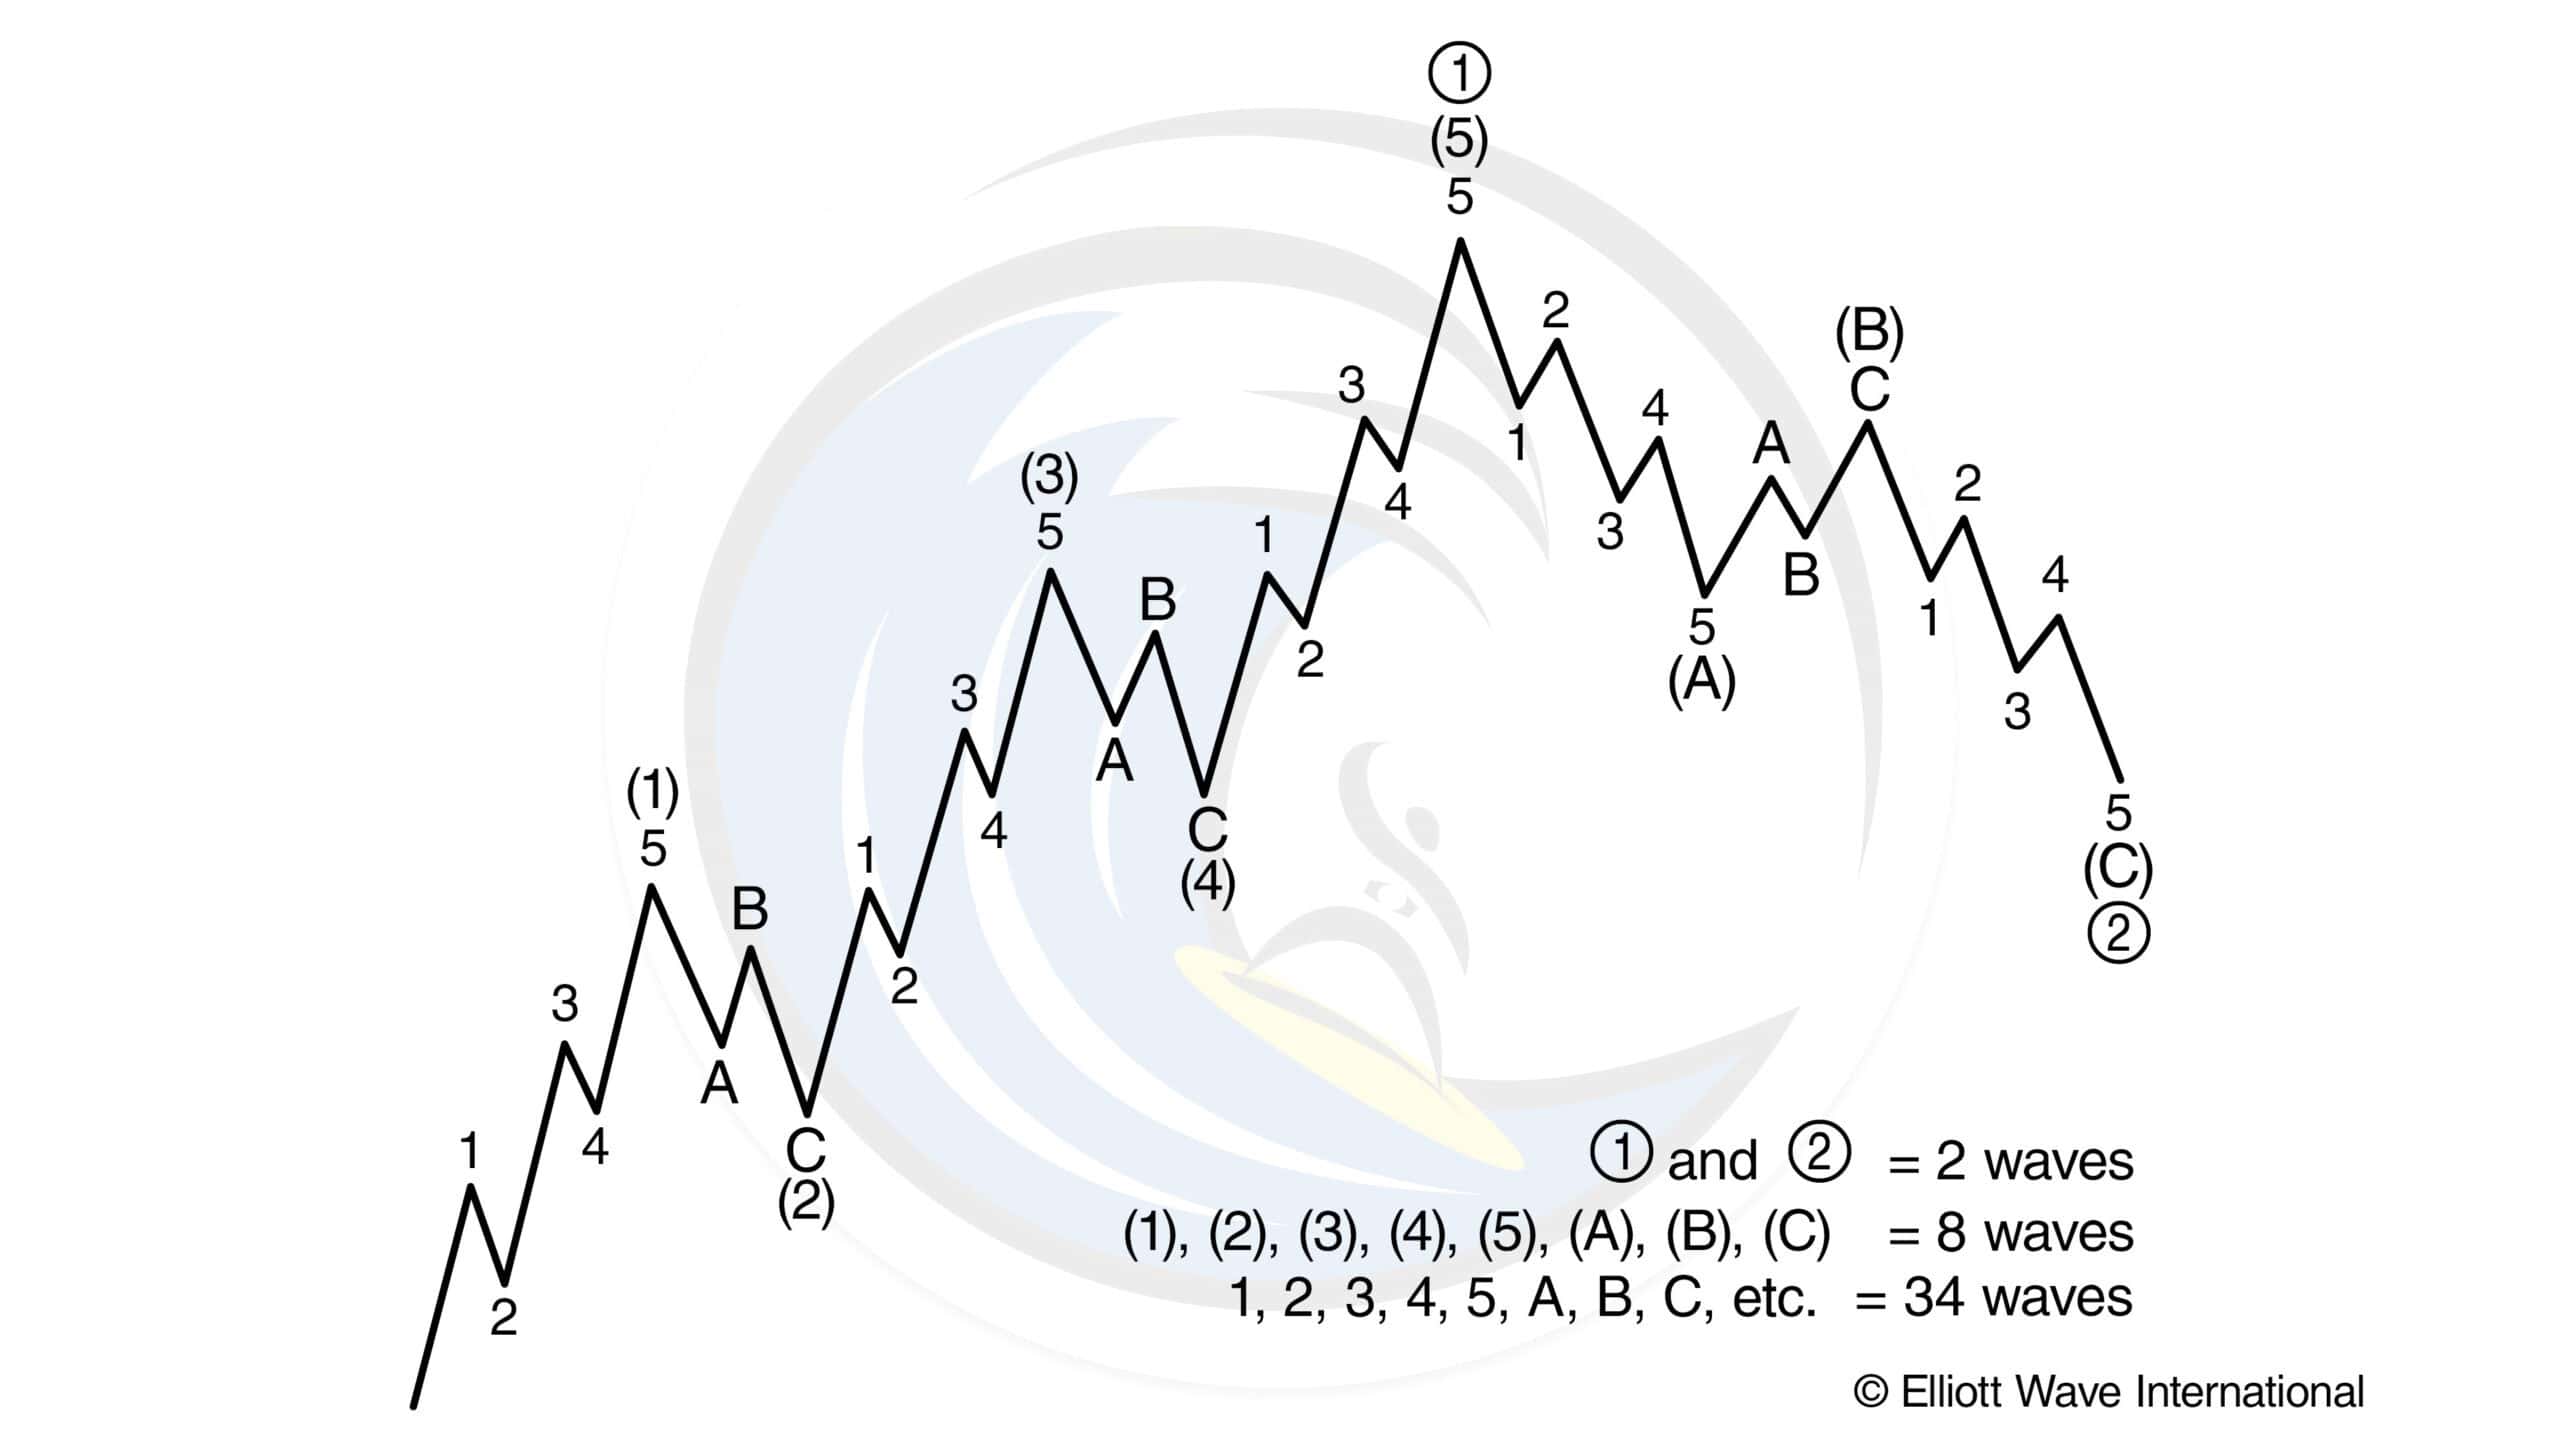
In the above illustration, waves 1, 2, 3, 4 and 5 together complete a larger impulsive sequence, labeled wave (1). The impulsive structure of wave (1) tells us that the movement at the next larger degree of trend is also upward. It also warns us to expect a three-wave correction — in this case, a downtrend.
That correction, wave (2), is followed by waves (3), (4) and (5) to complete an impulsive sequence of the next larger degree, labeled as wave 1. At that point, again, a three-wave correction of the same degree occurs, labeled as wave 2.
So, in applying the Elliott Wave Principle, our first task is to look at charts of market action and identify any completed five-wave and three-wave structures. Only then can we interpret where the market is and where it’s likely to go.
But while applying the Elliott Wave Principle to any chart, we must keep in mind an important point. The Elliott Wave Principle does not provide certainty about any one market outcome. Instead, it gives you an objective means of determining the probability of a future direction for the market. At any time, two or more valid wave interpretations usually exist. So, it’s important for any investor or trader to carefully assess the probability of each interpretation.
View the Elliott Wave Principle as your road map to the market and your investment idea as a trip. We start the trip with a specific plan in mind, but conditions along the way may force us to alter our course. “Alternate counts” are simply side roads that sometimes end up being the best path.
Elliott’s highly specific rules keep the number of valid interpretations (or “alternate counts”) to a minimum. The analyst usually considers as “preferred” the one that satisfies the largest number of guidelines. The top “alternate” is the one that satisfies the next largest number of guidelines, and so on. Alternates are an essential part of using the Elliott Wave Principle.
Another key to applying the Elliott Wave Principle is Fibonacci ratios. Few investors realize that Fibonacci analysis of the markets was pioneered by R.N. Elliott. The use of Fibonacci ratios requires a valid Elliott wave interpretation as a starting point. Elliott had two chief insights concerning Fibonacci relationships within waves. First, corrective waves tend to retrace prior impulse waves of the same degree in Fibonacci proportion — common wave relationships include 38%, 50% and 62%. Second, impulse waves of the same degree within a larger impulse sequence tend to relate to one another in Fibonacci proportion.
Wave interpretation rules and Fibonacci relationships together are powerful tools for establishing investment strategies and reducing risk exposure. Applying the Elliott Wave Principle aids investors in deciding where to get in, where to get out and at what point to give up on a strategy. Thus, the Elliott Wave Principle lets you identify the highest probability direction for the market.
The basics of the Wave Principle remain as Elliott formulated them. Those basics are fully described in the standard textbook of wave analysis, Elliott Wave Principle — Key to Market Behavior, by A.J. Frost and Robert R. Prechter, Jr. (Prechter is founder and president of Elliott Wave International.) That book rescued the Elliott Wave Principle from obscurity and propelled it to worldwide acceptance as perhaps the most sophisticated form of technical analysis. Remember — applying the Elliott Wave Principle is simple, but mastering that application takes years of practice and hard work. Yet, it is worth it to take the time and learn how to make proper counts. There are several Elliott wave software applications out there that claim to do all the best wave counts for you, but with all the variables in the market, it is much better to make the counts yourself.
What is an Elliott wave and What Does it Look Like?
Elliott waves are the basic building block of the Wave Principle.
The Wave Principle is Ralph Nelson Elliott’s discovery that social, or crowd, behavior trends and reverses in recognizable patterns. Elliott discovered that the ever-changing path of stock market prices reveals a structural design that in turn reflects a basic harmony found in nature. From this discovery, he developed a rational system of market analysis. Elliott isolated 13 patterns of movement, or “waves,” that recur in market price data and are repetitive in form but not necessarily repetitive in time or amplitude. He named, defined and illustrated the patterns. These patterns are Elliott waves.
These Elliott waves link together to form larger versions of those same patterns. They, in turn, link to form identical patterns of the next larger size, and so on. The result is the illustration you see below:
In markets, progress ultimately takes the form of five Elliott waves of a specific structure. As you can see below in the most basic Elliott wave structure, waves (1), (3) and (5) actually affect the directional movement. Waves (2) and (4) are countertrend interruptions.
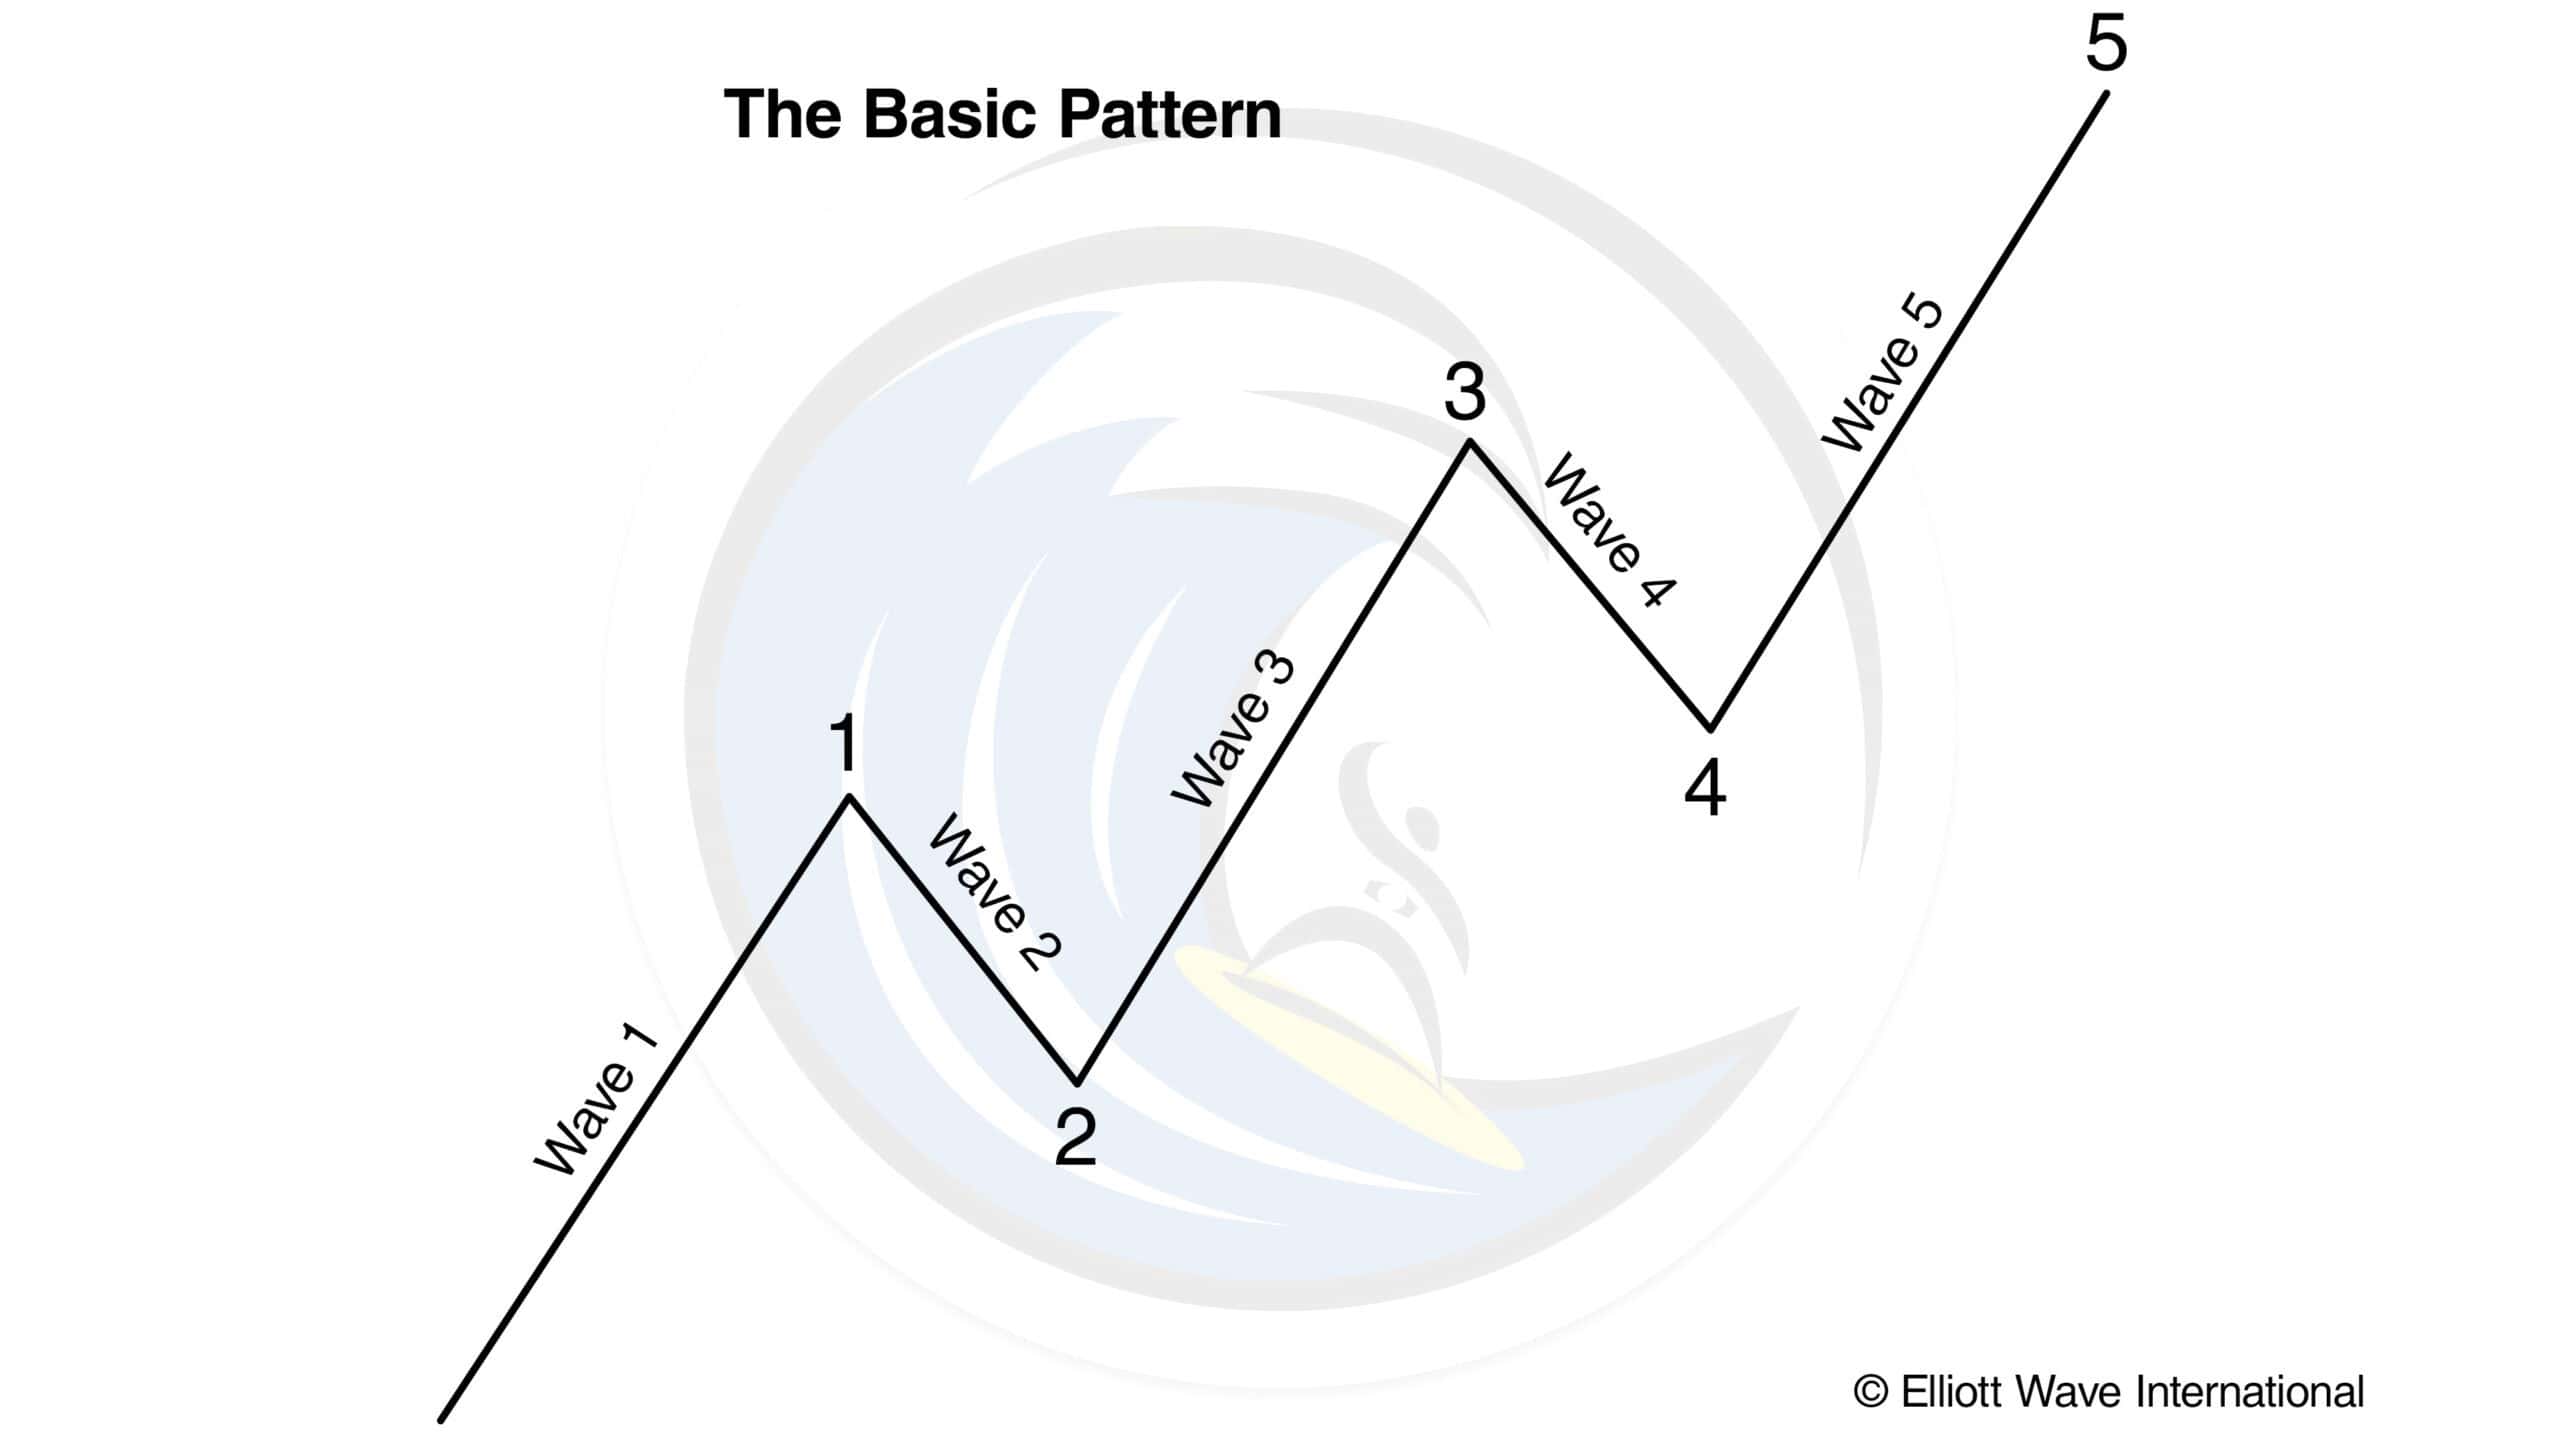
The two interruptions are a requisite for overall directional movement to occur. And though there are several variations of Elliott waves, all of them fit into the basic structure you see above. The stock market is always somewhere in the basic five-wave pattern at the largest degree of trend. Because the five-wave pattern is the overriding form of market progress, all other patterns are subsumed by it.
How Does Elliott Wave Analysis Work?
Elliott wave analysis is based upon the Elliott Wave Principle, which states that investor psychology is the real engine behind the stock markets.
Robert Prechter, Elliott Wave International’s founder and president, explains:
“The Wave Principle is a catalog of the ways that the crowd goes from the extreme point of pessimism at the bottom to the extreme point of optimism at the top. It is a description of the steps human beings go through when they are part of the investment crowd, in order to change their psychological orientation from bullish to bearish. Since people don’t change much, the path they follow in moving from extreme pessimism to extreme optimism and back again tends to be the same over and over, regardless of news and extraneous events.”
Therefore, Elliott wave analysis involves deciphering the psychological orientation of the investment crowd through the wave patterns evolving in various stock markets. And since we here at Elliott Wave International use Elliott wave analysis on all of the world’s major stock indexes, we’re confident we can gauge how investor psychology is trending.
In order to utilize Elliott wave analysis, you must become familiar with the Elliott Wave Principle. The Elliott Wave Principle enables you to properly decipher the wave patterns unfolding in each stock market and then make predictions on which wave patterns are most likely to occur next — this is the basis of Elliott wave analysis.
Each Elliott wave structure carries with it unique personality traits and is followed by another specific and unique structure. Studying these patterns eventually allows analysts to be able to predict both what may occur next, and — possibly even more importantly — what won’t happen next.
Elliott wave analysis requires patience and diligence, but it is very simple to employ.
What is Technical Analysis? How is it different from Fundamental Analysis?
Technical analysis is a method of evaluating stock prices by relying on market data, such as charts of price and volume, to help predict future market trends. Investors who rely on technical analysts strive to accurately predict the future price of a stock by looking at its historical prices and other trading variables.
Technical analysis hinges on the belief that psychology influences trading in a way that enables predicting when a stock will rise or fall.
Bob Prechter, Elliott Wave International’s founder and president, has called the Elliott Wave Principle “the purest form of technical analysis.” He explains, “The Wave Principle is a catalog of the ways that the crowd goes from the extreme point of pessimism at the bottom to the extreme point of optimism at the top. It is a description of the steps human beings go through when they are part of the investment crowd, to change their psychological orientation from bullish to bearish. Since people don’t change much, the path they follow in moving from extreme pessimism to extreme optimism and back again tends to be the same over and over, regardless of news and extraneous events.”
Elliott wave analysis and technical analysis differs from fundamental analysis in that fundamental analysis relies on the belief that stock markets and the people trading stocks are rational. We at Elliott Wave International believe that — as human beings — investors and traders are not rational, rather they follow similar “paths.” We refer to this as herding, and it is key in the understanding of technical analysis.
“So wait… I can really learn to predict the markets?”

Yes. Markets aren’t rational. For every action, there isn’t always an equal and opposite reaction.
What drives prices isn’t logic, but emotion. Market emotions unfold in predictable patterns called Elliott waves. That’s what makes prices predictable.
What you just read is from the Wall Street bestseller, “Elliott Wave Principle: Key to Market Behavior.” For 40+ years, it’s been a top-shelf book on unbiased market analysis.
Amazon reviewers call it “classic and essential” and “the bible of the theory.” Now, you can get instant, FREE access to the full online version of this book ($29 value).