The granddaddy of cryptocurrencies hits year-and-a-half high
Bitcoin bulls have been as happy as the proverbial “bug in a rug” lately.
On Nov. 9, the digital currency hit a year-and-a-half high of $37,972. Of course, that’s a far cry from its all-time high of $68,906 in Nov. 2021, yet it’s nothing to sneeze at when you consider bitcoin was trading just shy of $26,600 when our September 2023 Global Market Perspective published.
On Sept. 1, the monthly publication showed this chart and said:
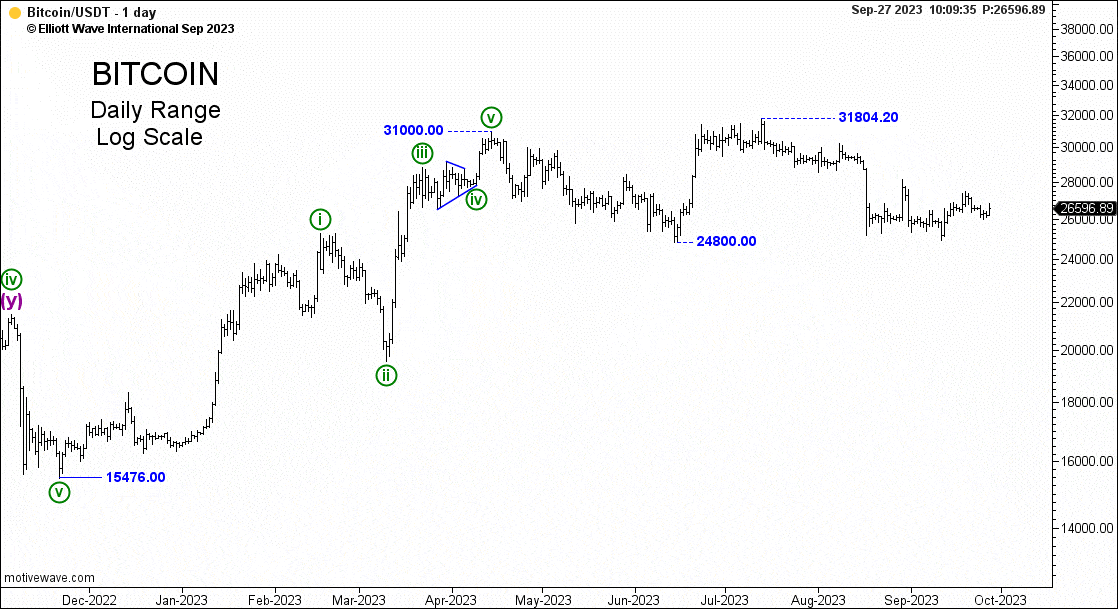
The second-wave correction in Bitcoin discussed last month carried over to September but should otherwise be nearing a conclusion…If Bitcoin is tracing out an expanded flat for wave 2, it should end with a low beneath 24800.
Around that time, there were those who thought bitcoin was going to drop way lower than $24,800.
Indeed, on Sept. 8, a headline from The Times in the U.K. asked:
Is a bitcoin crash coming?
Just a few days after that headline published, bitcoin hit a low of $24,901, and as noted, since then, went on to hit that multi-month high of $37,972. That was a 52% rally from the low.
Tony Carrion is our Senior Cryptocurrency Analyst and back in September, he also made a bullish call on Ethereum. On Nov. 9, the cryptocurrency climbed above $2,000 for the first time since April. That was a jump of about 7% versus it’s high the prior day.
Of course, cryptocurrency investors are wondering if the rally will last.
Get a handle on what Tony Carrion’s Elliott wave analysis and the Global Market Perspective anticipate next for bitcoin and ether by following the link below.
High-Confidence Chart Patterns in Worldwide Financial Markets
You can see all these charts in the 40+ pages of our professional Global Market Perspective — which covers 50+ world markets each month.
This monthly publication was once reserved only for institutional subscribers. Today, Global Market Perspective is available to any individual investor who wants to benefit from its in-depth and comprehensive analysis.
Subscribers get analysis of the Asian-Pacific, Europe, the U.S. and other regions of the world.
See high-confidence chart patterns of cryptocurrencies, global equity indexes, individual stocks, global bonds, forex, metals, energy and much more.
Follow the link below to get started now.