Real Market Forecasts
Scroll Through These Examples to See How We Work
Below you will find direct excerpts from our publications — real-time forecasts that helped subscribers prepare for some of the biggest market moves before they happened.
Many of these setups occurred at times when the market looked lazy and no one was paying attention, but the waves forecasted a dramatic change. At other times, when market drama had investors passionately engaged, we quietly called an end to the trend.
Not all our forecasts work out, but we challenge you to find another service this dedicated to getting it right time after time.
 Intraday Stocks Pro Services
On April 2, 2026 while bearish sentiment was extreme and many expected lower prices, subscribers to Intraday Stocks Pro Services were shown a very different setup in the S&P 500. In his 3:35 p.m. intraday update, analyst Robert Kelley posted this chart and wrote:
Analysis/Forecast:

“The larger count labels today’s low as the bottom of a second wave pullback. That’s due to the clear three-wave drop into today’s low.
If this count is right there will be a sizable advance next week. For now prices need to hold above 6501.90, the .786 retracement of wave iii so far, to keep this scenario in preferred status.”
What Happened Next?
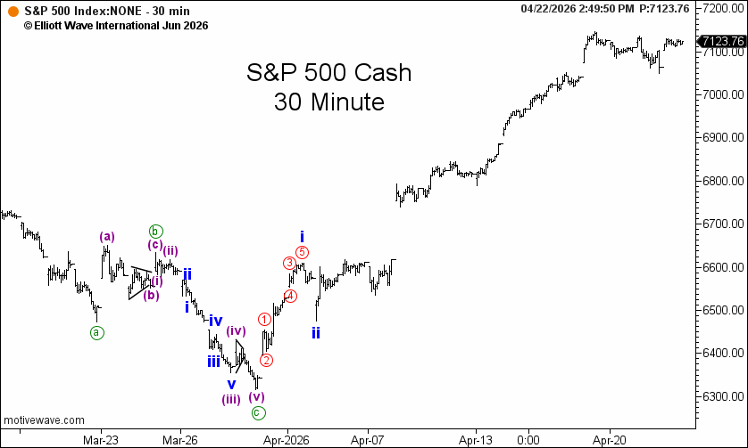
The labeled wave ii low held. And prices exploded. From that April 2 low, the S&P 500 surged to 7123.76 — a move of roughly +8.8%, part of what Kelley called “one of the fastest rallies in history.”
 Elliott Wave Financial Forecast
As optimism toward the Robinhood Markets Inc. (HOOD) stock reached a new extreme in October 2025, analysis from our Elliott Wave Finanical Forecast identified signs that the rally was likely nearing completion.
Analysis/Forecast:
October 31, 2025:

“…the five-wave form of Robinhood’s rally to a new all-time high on October 6 suggests its latest rise is ending.
King Retail should quickly celebrate its latest position on top because it is all about to change.”
What Happened Next?
The warning proved timely:
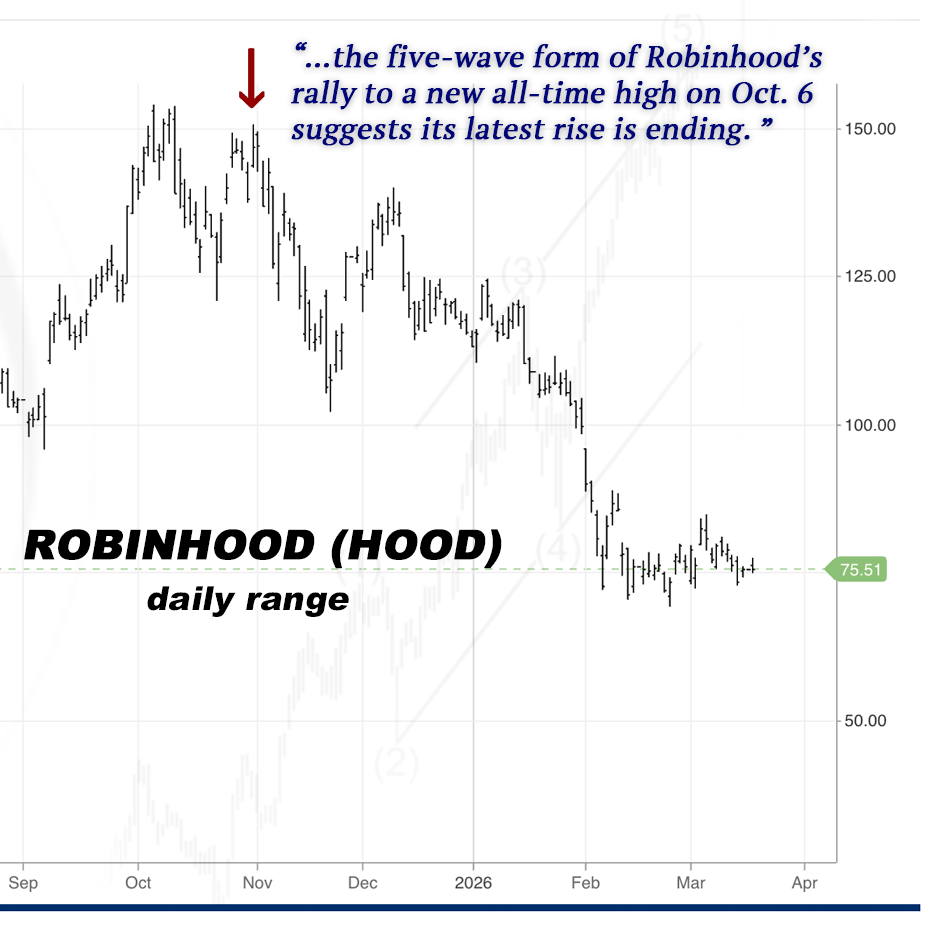
By February 24, 2026, HOOD had declined to an intraday low of $69.22 — a drop of roughly 55% from the October peak.
 Short Term Update
In early October 2023, statistics showed that 90% of traders were bearish on gold. Our Flagship Short Term Update, however, had identified an “approaching wave 2 low” — signaling that a powerful wave 3 rally was likely next — and alerted subscribers to the opportunity on October 4.
Analysis/Forecast:
October 4, 2023:
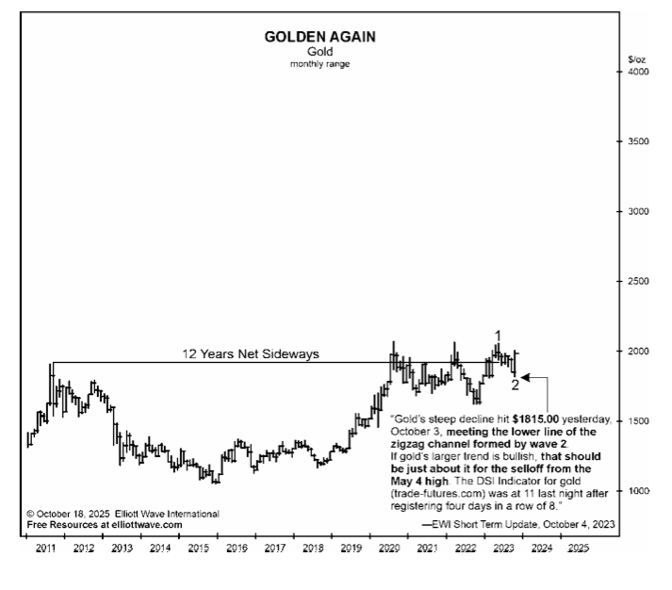
“Gold’s steep decline hit $1815.00 yesterday, October 3, meeting the lower line of the zigzag channel formed by wave 2. If gold’s larger trend is bullish, that should be just about it for the selloff from the May 4 high. The DSI Indicator for gold (trade-futures.com) was at 11 last night after registering four days in a row of 8.”
What Happened Next?
Wave 2 had bottomed that very day:
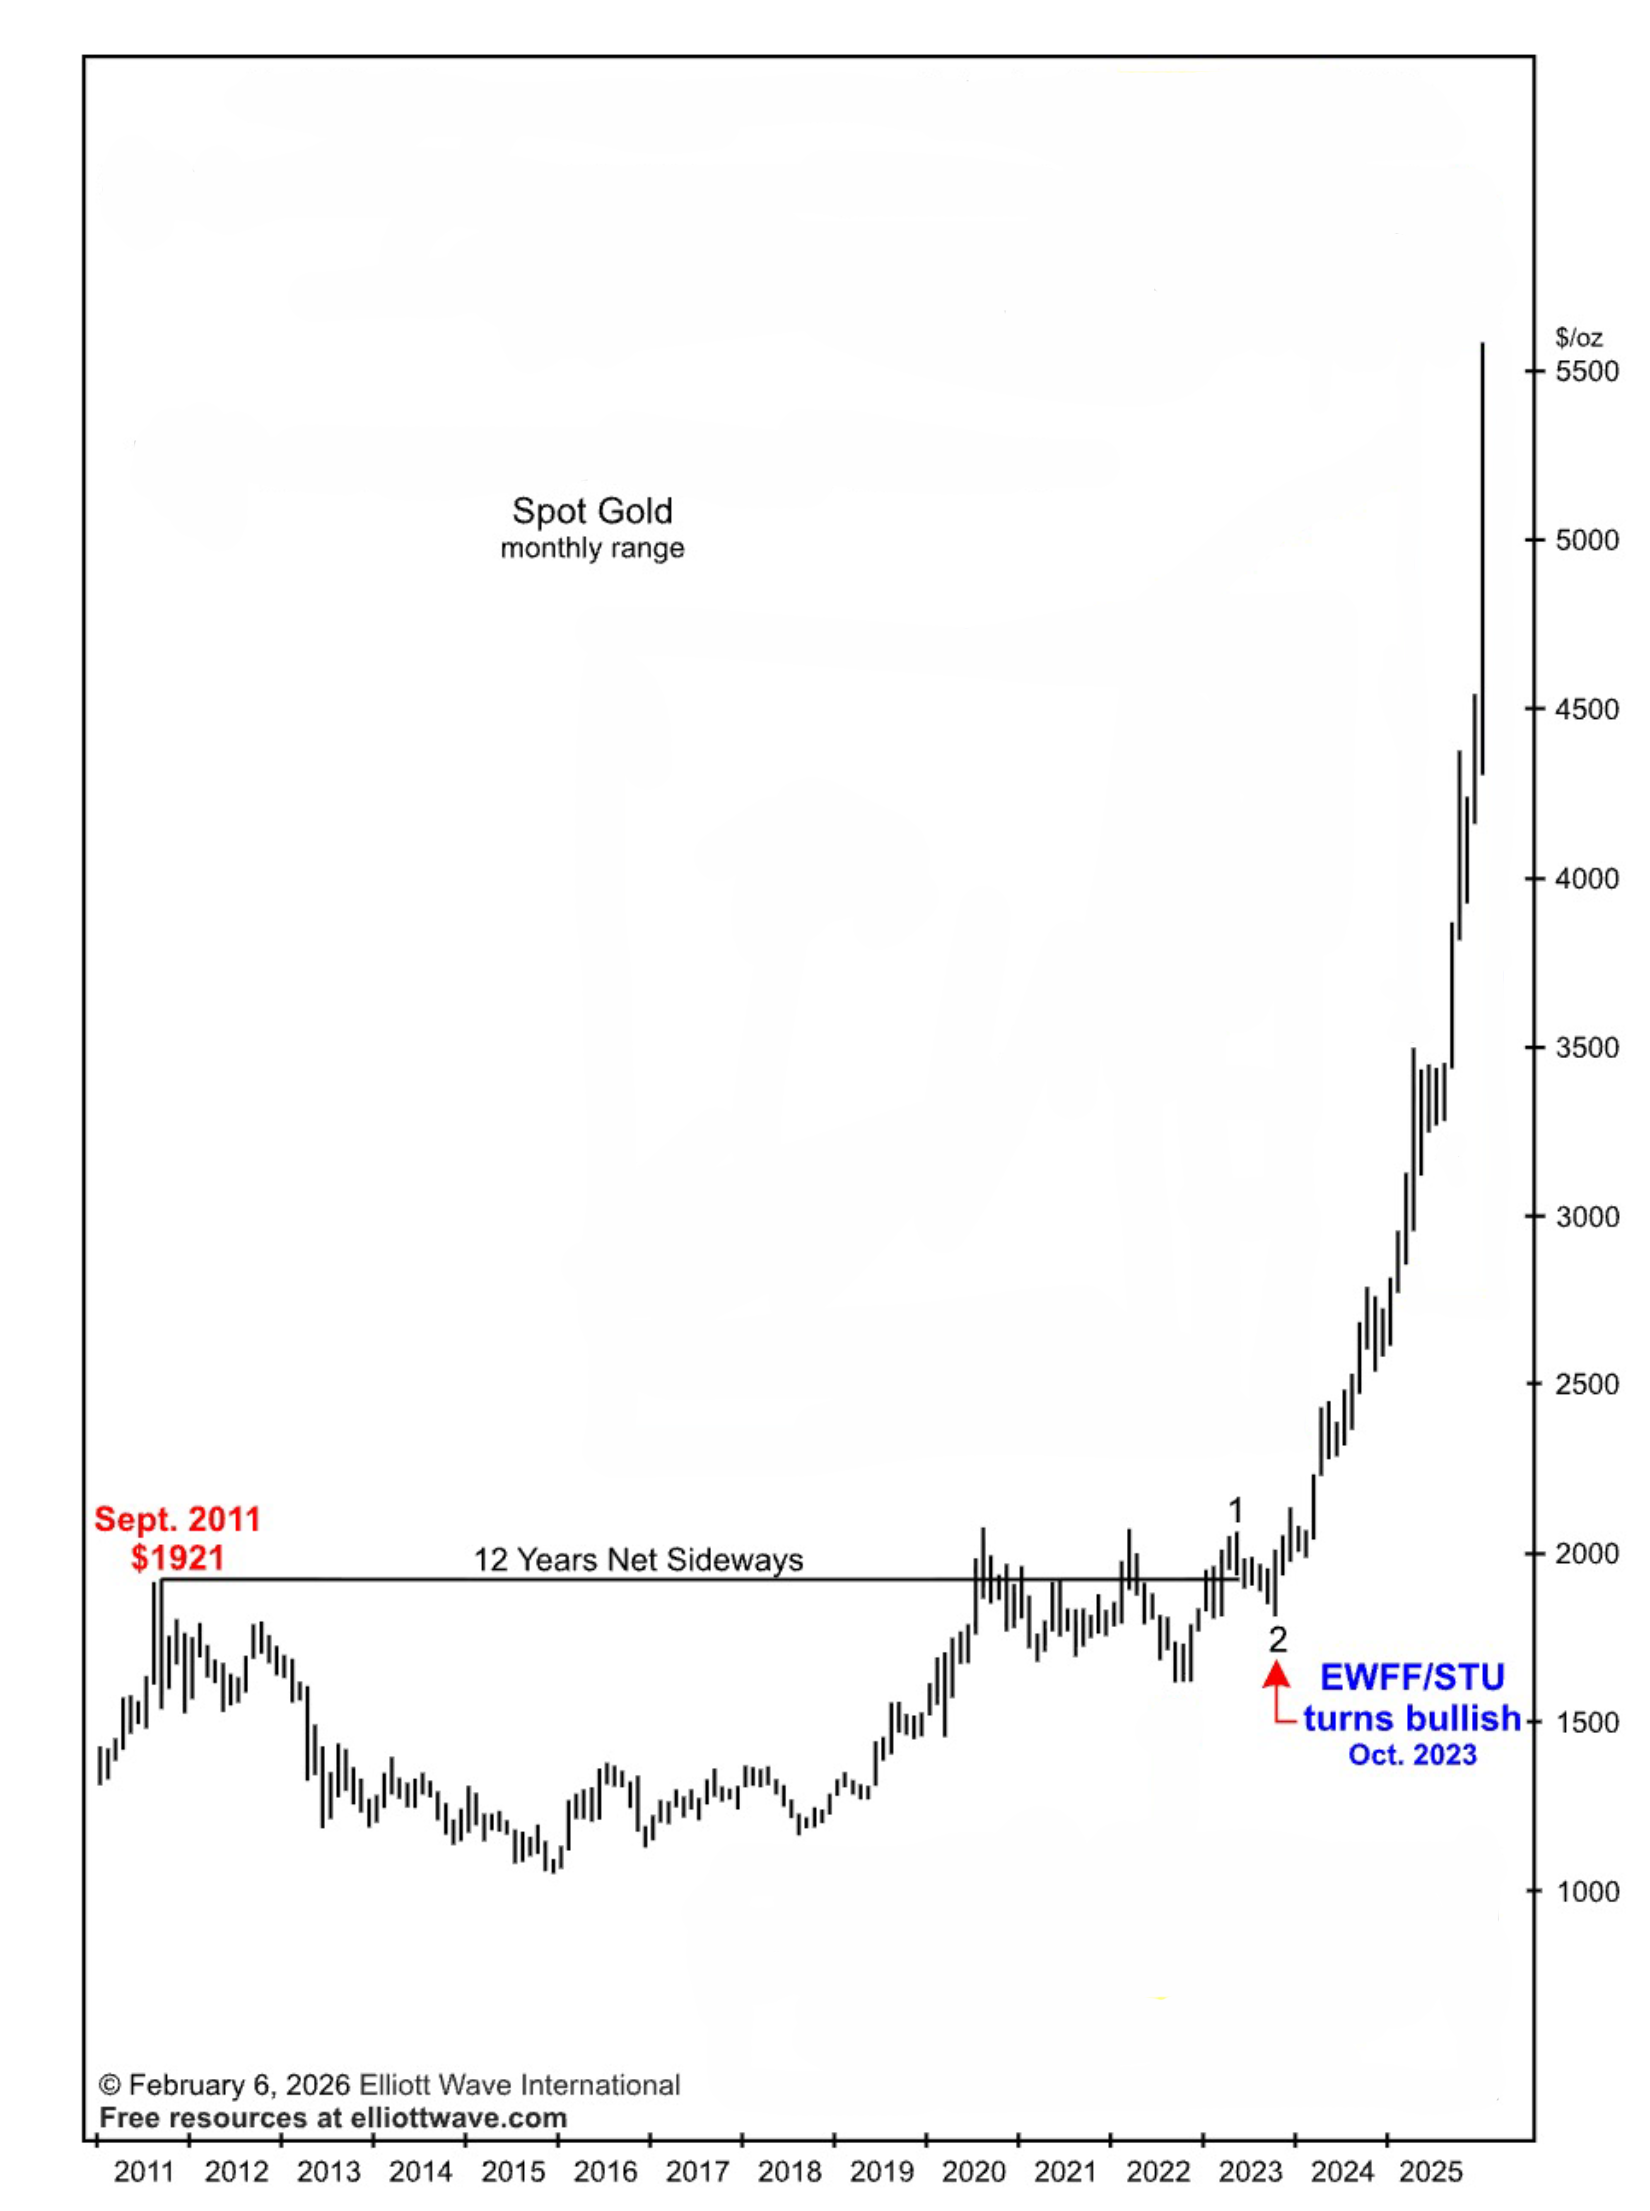
By October 2025, gold had traded above $4,000/ounce and later surged to a record high above $5,600 — nearly tripling as the larger bull market structure unfolded.
 Commodity Junctures
In our February 2026 live webinar for Commodity Junctures subscribers, analyst Jim Martens walked subscribers through a developing setup in Cotton Futures that suggested the decline could be ending. The key pattern: an ending diagonal — an Elliott wave structure that often appears near major turning points. Jim walked through this chart and explained:
Analysis/Forecast:
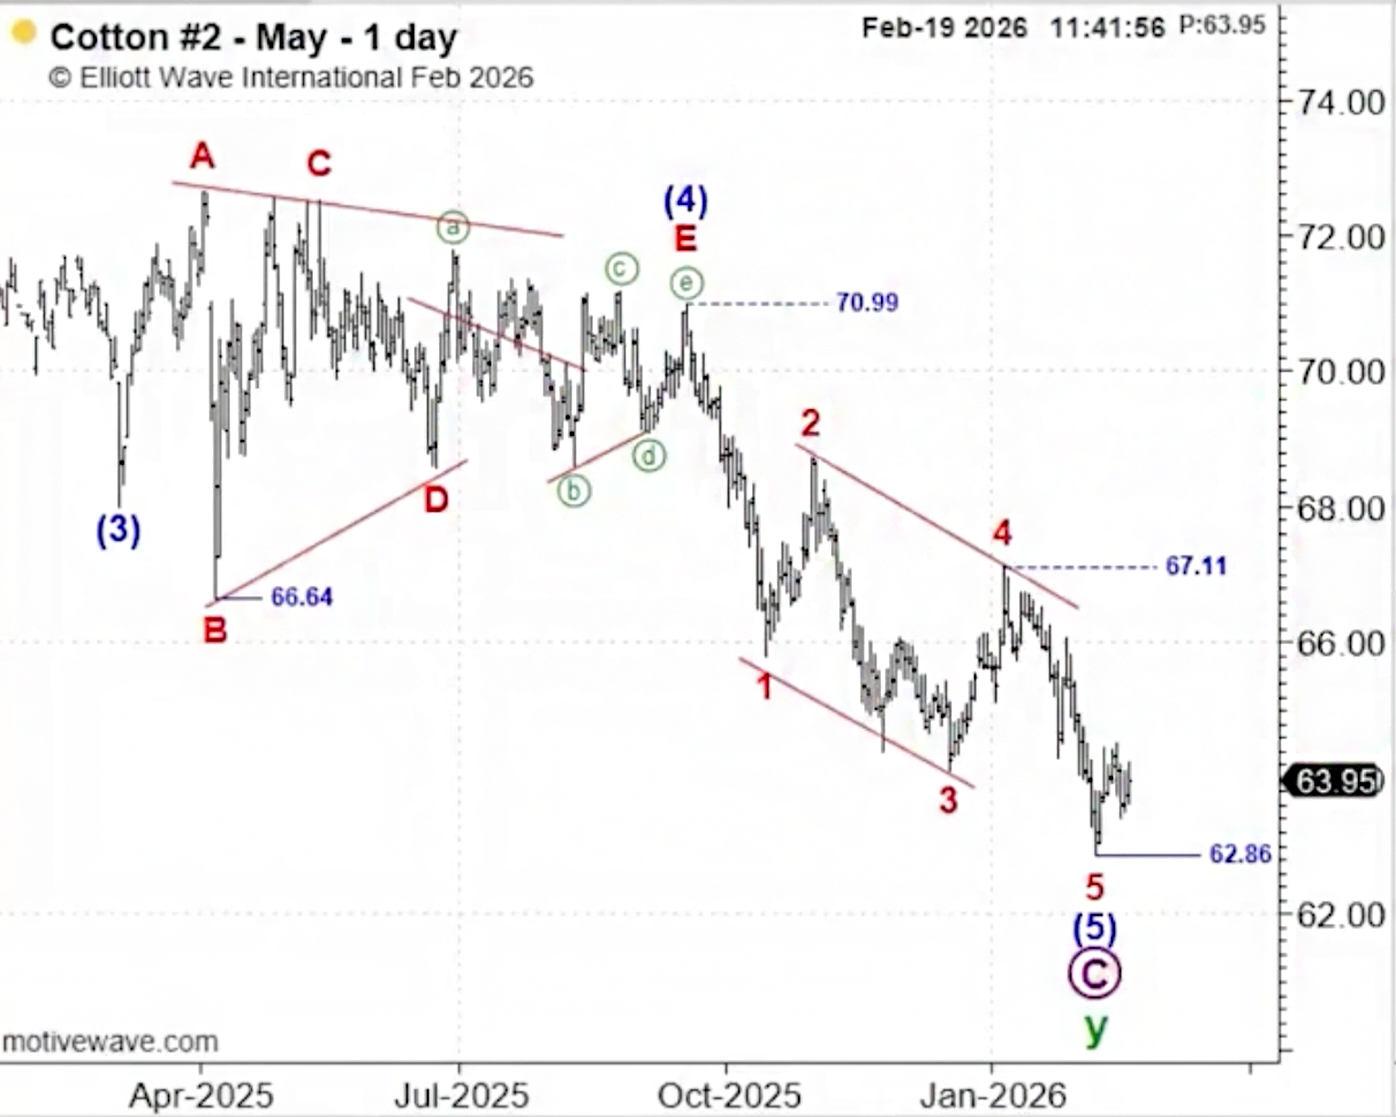
“It unfolded, I think, as an ending diagonal… as the name implies, a terminal movement…
Markets often offer second chances, and that’s what I how I look at this lower degree rally followed by a setback…Maybe the market’s giving you another opportunity, and now it’s time to think about being bullish against 63.64.”
What Happened Next?
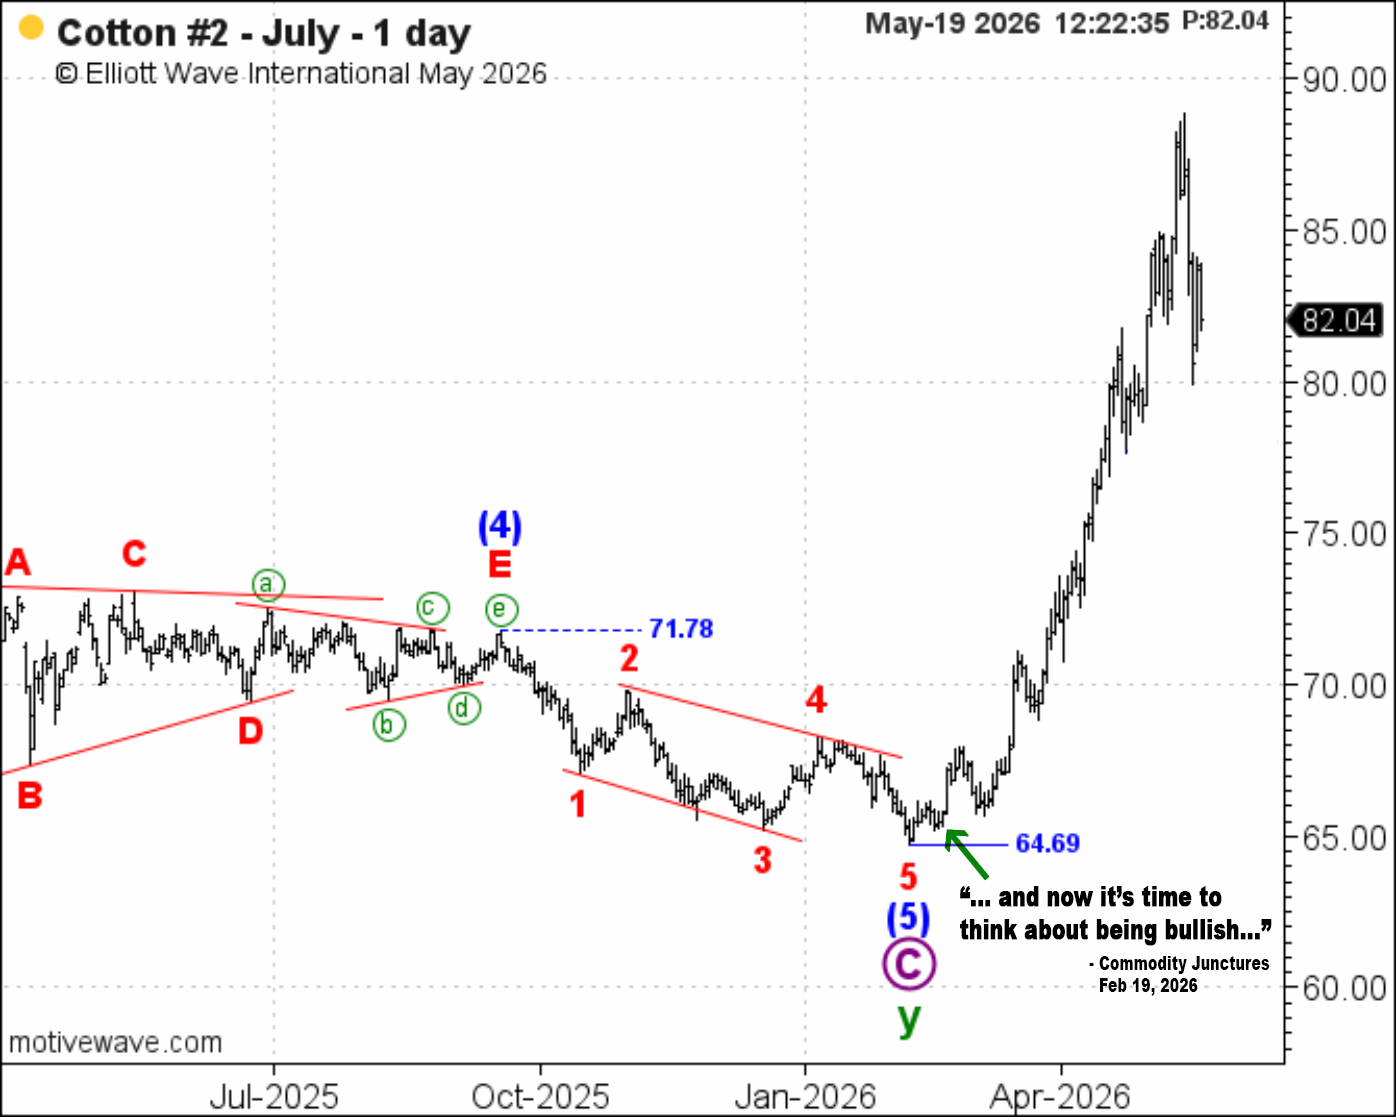
At the time of the webinar, Cotton Futures was trading near 63.95. Over the following months, cotton rallied to nearly 90 — a move of roughly +40%.
Energy Pro Services
As February 2026 came to a close, crude oil was trading near $67/barrel. On February 27, EWI’s Energy Pro Service identified what appeared to be the completion of a wave (ii) pullback — a setup suggesting a powerful “third-of-a-third” advance was about to begin.
Analysis/Forecast:
Intraday Update, February 27:
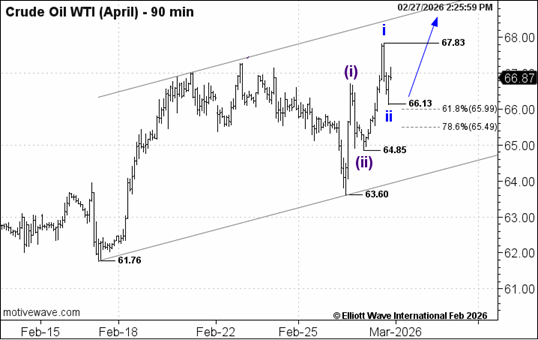
“Crude should ratchet on up in third-of-a-third fashion.”
What Happened Next?
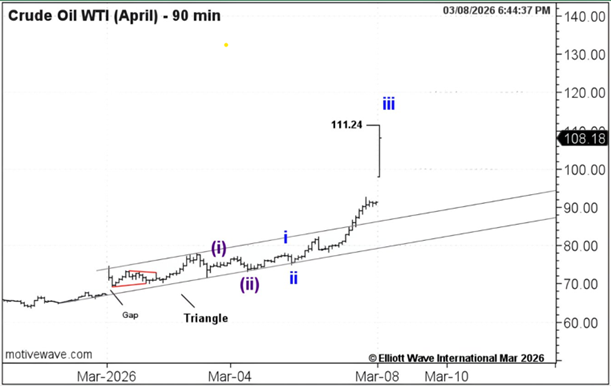
Just hours later came a 13% gap higher. Over the following days, crude accelerated almost vertically as wave iii unfolded, exploding above $115/barrel by March 8 — a rally of roughly +72% from the time of the forecast.
 Crypto Junctures
In a live Crypto Junctures webinar filmed on February 24, 2026 our analyst examined Hyperliquid (HYPE). He walked through the pattern on the chart below and explained that the corrective pattern looked near or at completion — setting the stage for a potential move higher.
Analysis/Forecast:
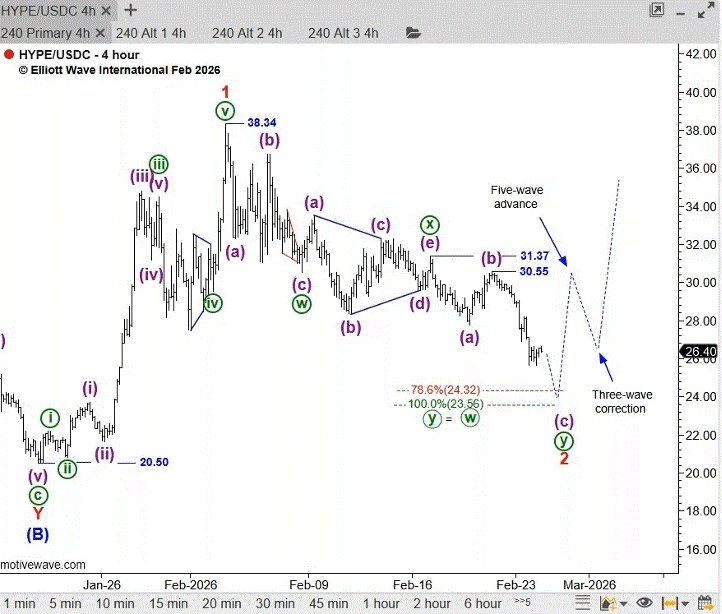
“I can make a decent case for the completion of the double zigzag… and then we’ll see a strong rally higher in red wave three.”
What Happened Next?
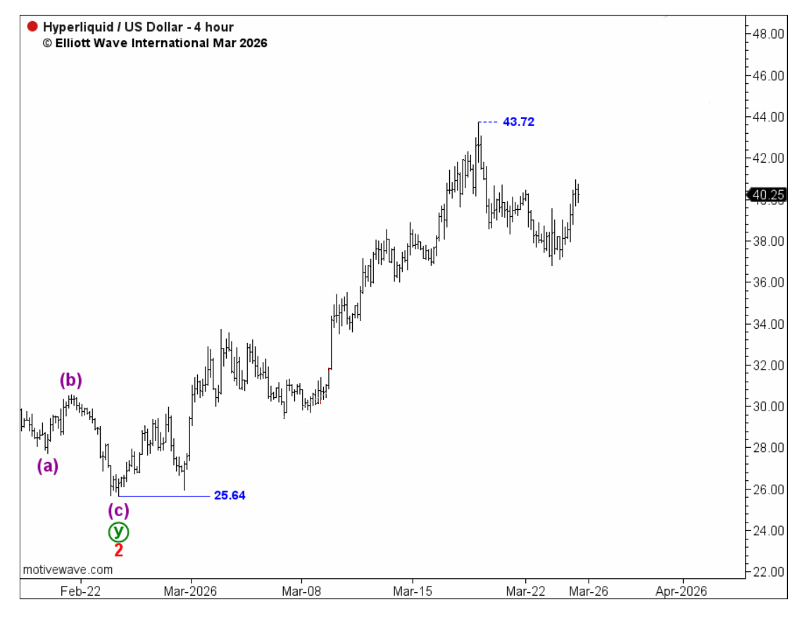
HYPE was $26.40 during the February 24 webinar. Less than a month later, it traded at $43.72 — a move of roughly +65%.
 Global Market Perspective
In the April 2024 issue of Global Market Perspective, EWI Chief Asian and Emerging Markets Analyst Mark Galasiewski spotted a completed expanded flat pattern (highlighted in red on the chart below) in an Emerging Market Leader, Xiaomi Corp. He alerted his subscribers to the bullish setup:
Analysis/Forecast:
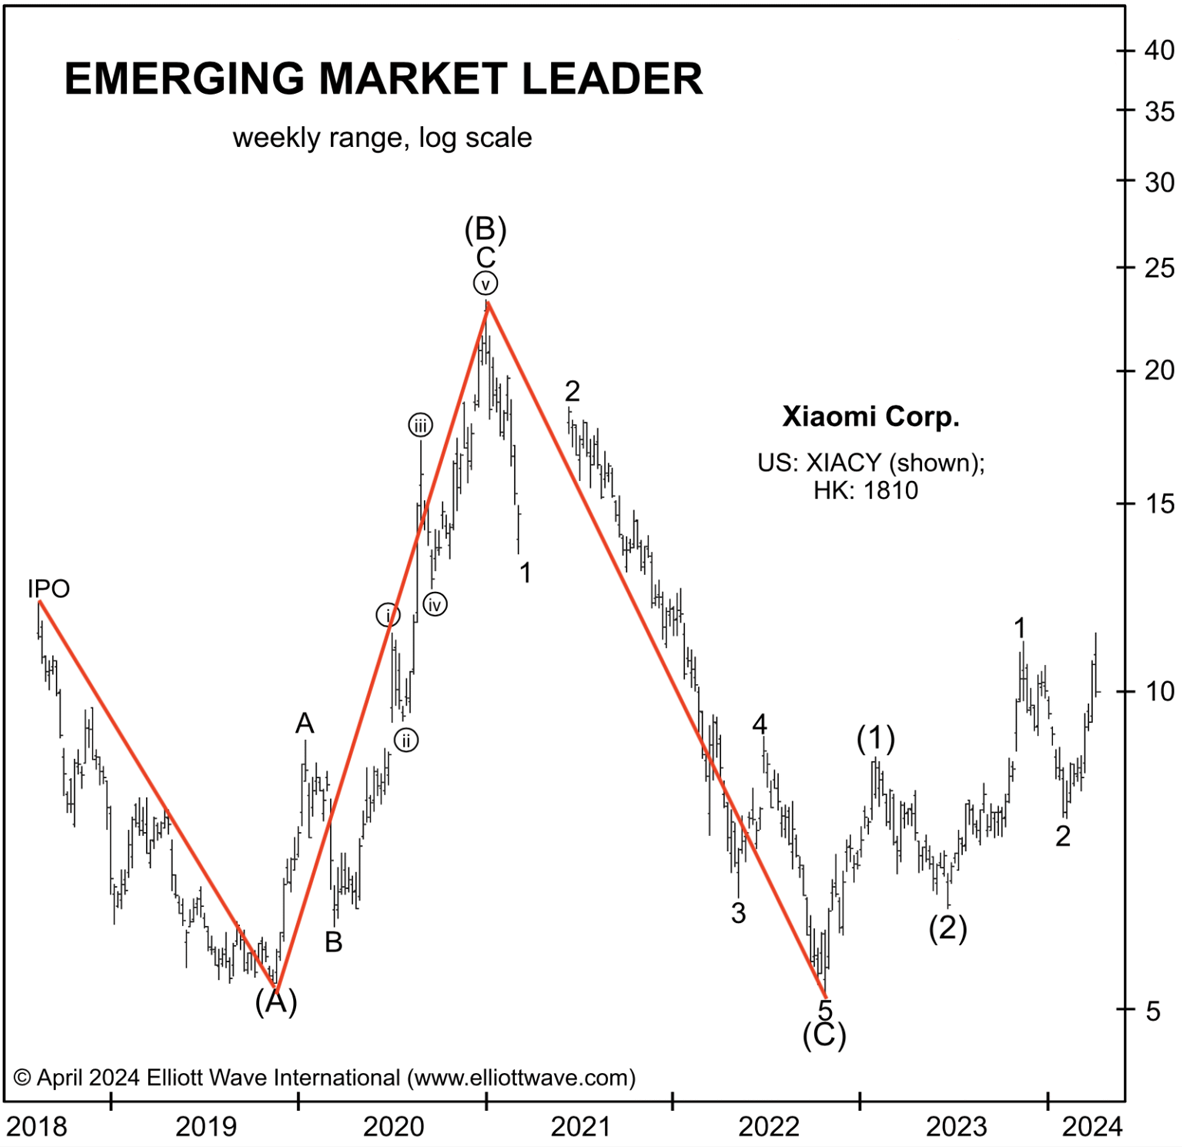
“We think that the company’s shares completed a flat correction from their 2018 IPO to a low in October 2022 and since then are tracing out a series of first and second waves in a new impulsive advance.“
What Happened Next?
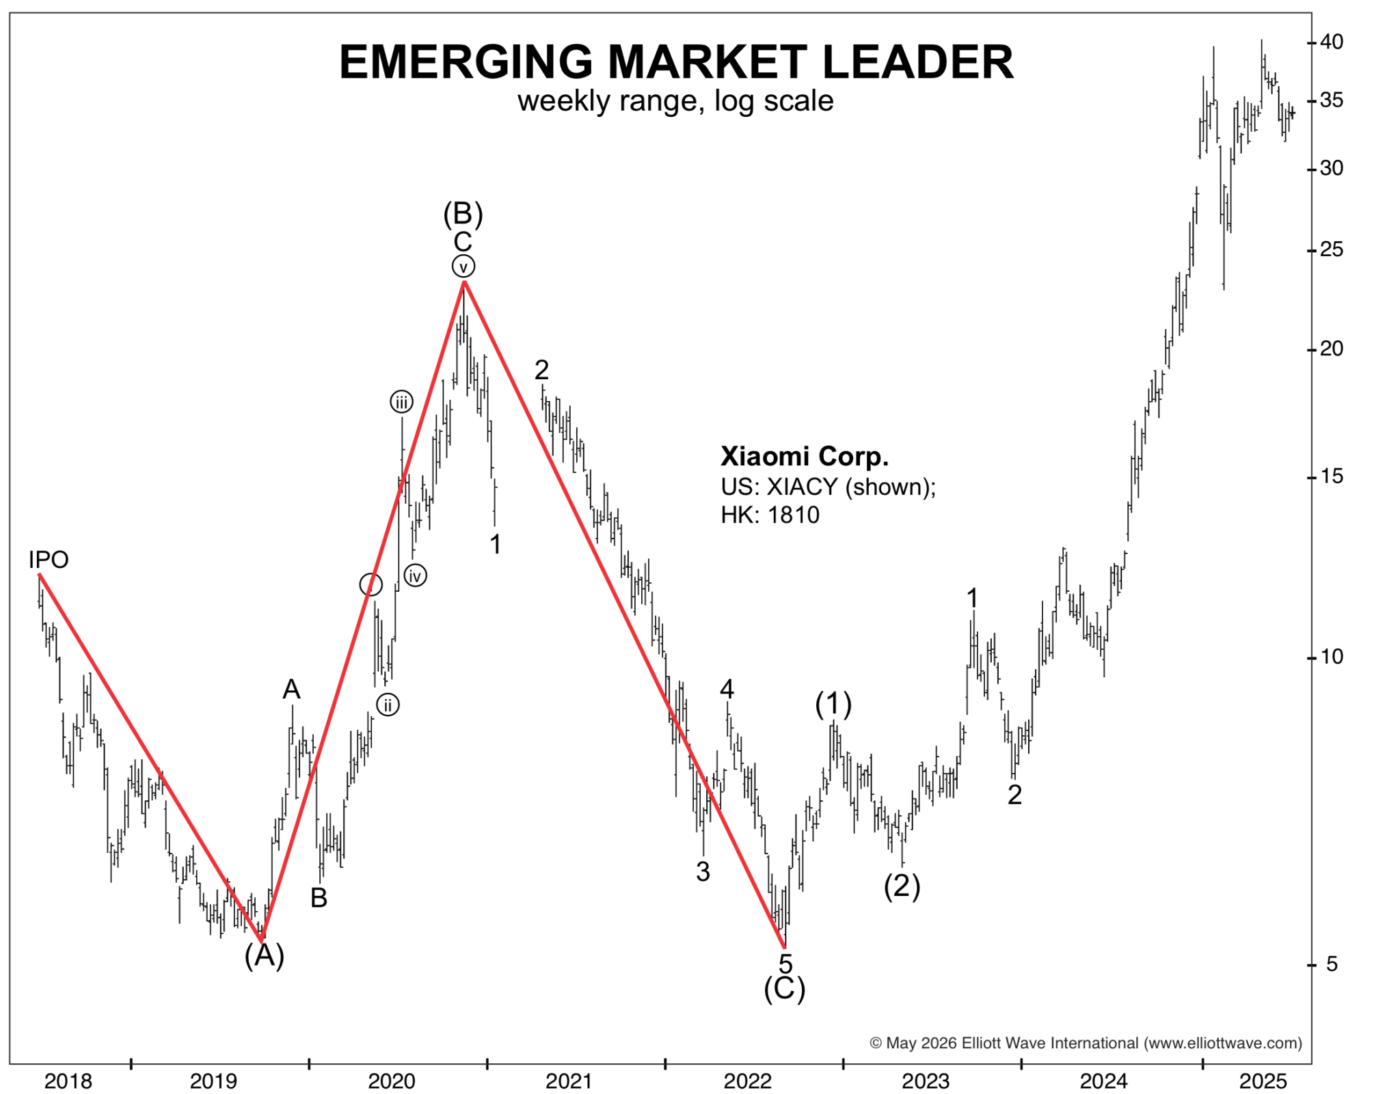
Xiaomi Corp. QUADRUPLED in a year!
 Flagship Services
IIn April of 2023, few investors were paying attention to silver. Our Flagship Services, however, were identifying the metal as one of the most overlooked opportunities in the financial markets.
Analysis/Forecast:
In April 2023, The Elliott Wave Theorist declared:
“Silver is probably the only commodity on earth selling for less than it did 43 years ago… Among all the world’s seasoned investments, it is the cheapest. Stocks are a religion. Property is a religion. Bitcoin is a religion. Nobody is paying attention to silver.”
One year later, in the April 2024 issue of The Elliott Wave Financial Forecast confirmed:
“Silver should trend with gold, and this week’s sharp advance indicates that prices are starting to align.”
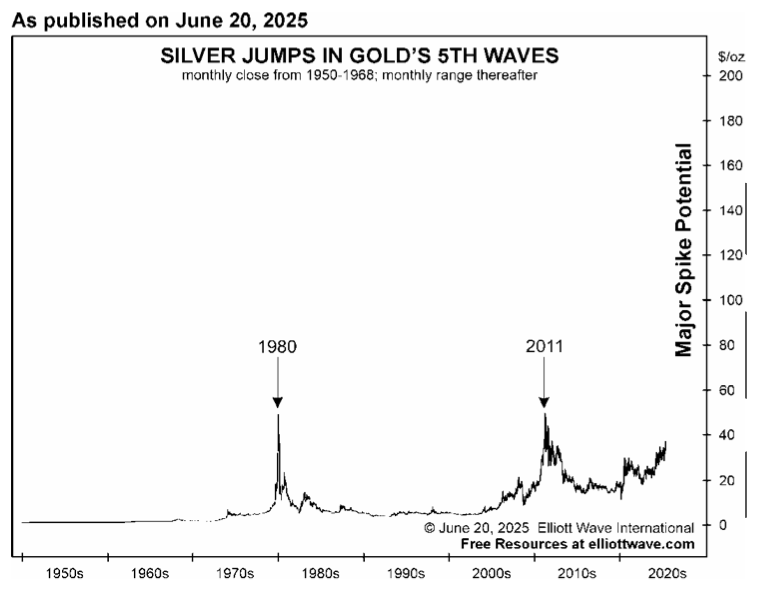
Then in June 2025, EWT showed this chart and told subscribers of a “Major Spike Potential” in the metal:
What Happened Next?
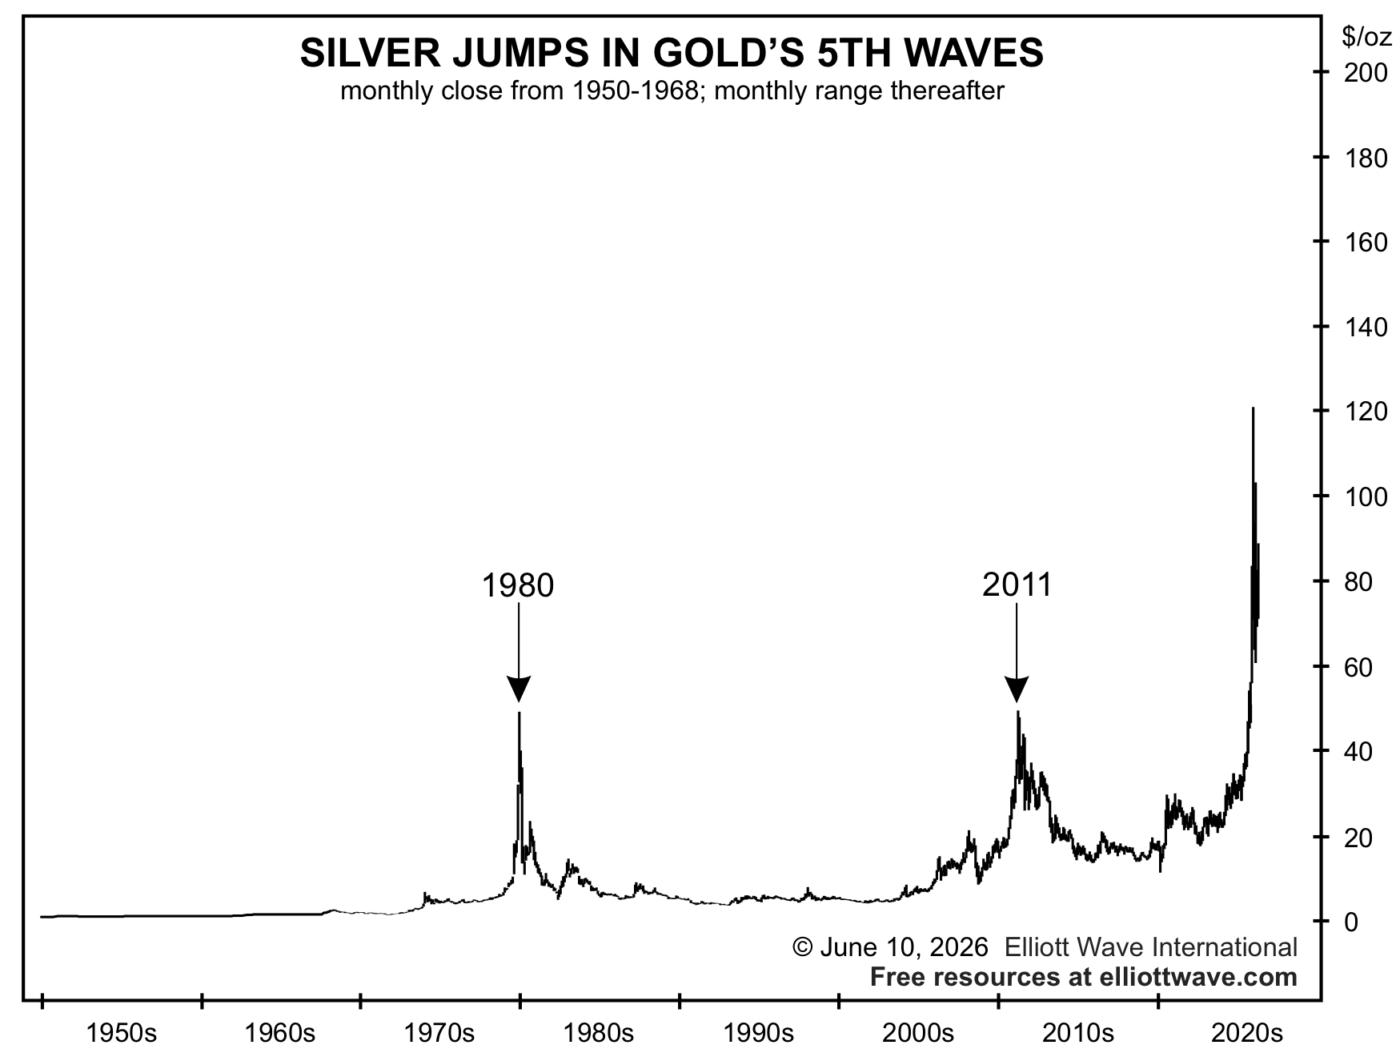
In October 2025, silver finally exceeded its 1980 all-time high, trading above $53/oz for the first time in more than four decades.
The breakout marked the beginning of a historic advance as silver eventually surged above $120/ounce in early 2026 — a move of roughly +400% from the time The Elliott Wave Theorist first highlighted the opportunity in April 2023.
Our forecasts were on this move early — and accurately.
 Elliott Wave Trader’s Classroom
On April 6, Trader’s Classroom subscribers saw veteran Elliott wave instructor Tony Carrion examined the wave structure in Semiconductor ETF (SMH). Tony argued the decline appeared corrective — more consistent with fourth-wave behavior. His conclusion: higher highs were still likely ahead.
Analysis/Forecast:
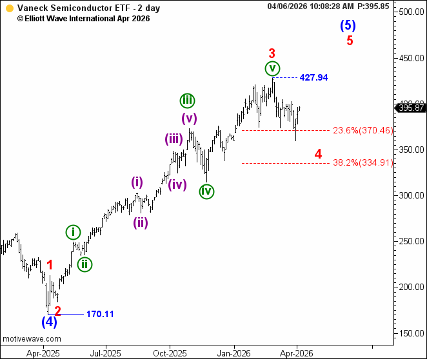
“The question right now is whether or not all the five waves are in place for us to consider this bull market has peaked. So, to me it hasn’t... That the correction that we’ve been getting over the past few months is what looks to me to be fourth-wave price action.“
“To sum up quickly, I think the wave patterns are saying there should probably be one more run to chase the all-time high.”
What Happened Next?
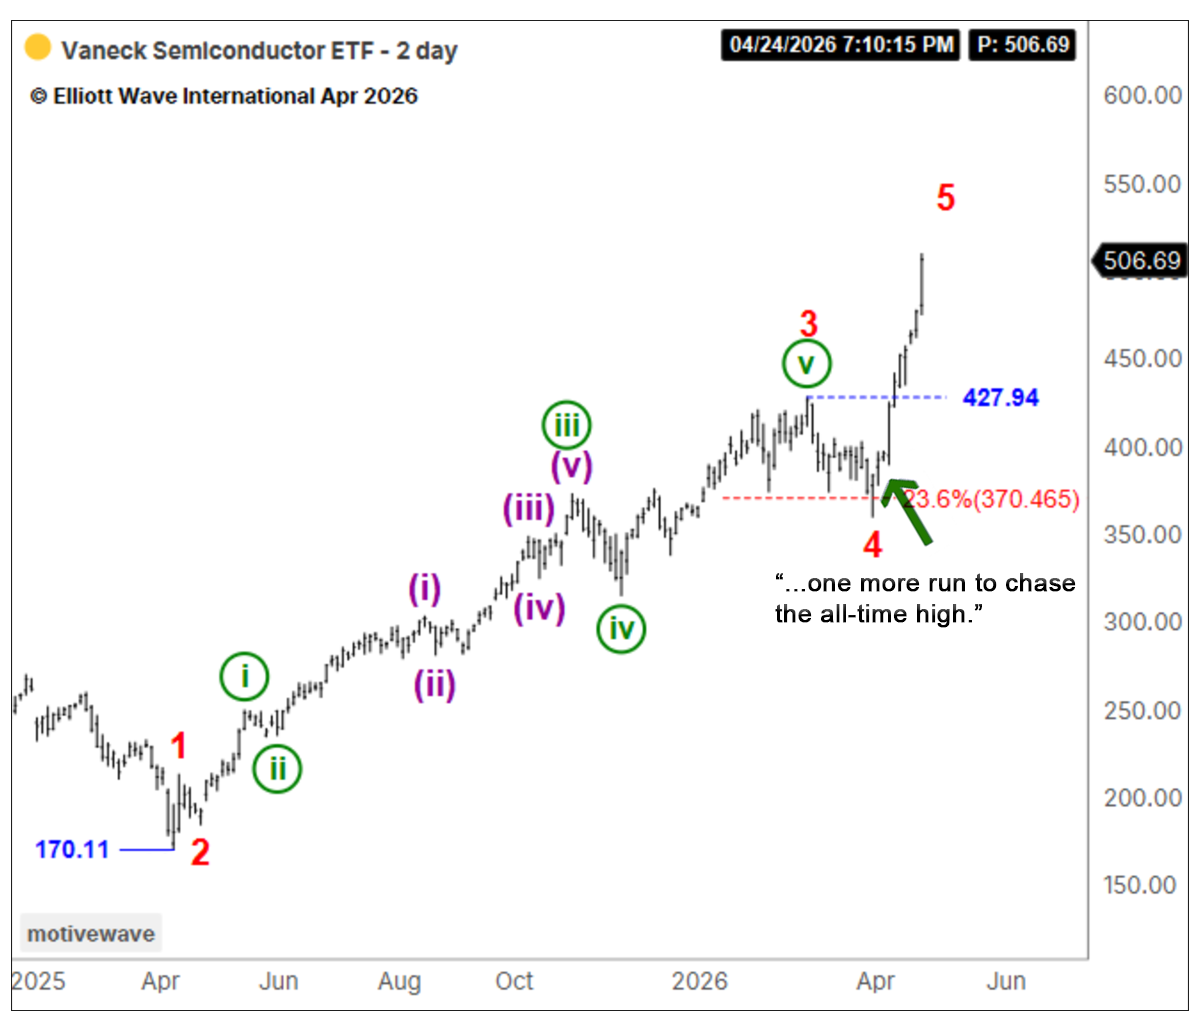
By April 24, SMH rallied roughly +30% to a new all-time high.
Crypto Pro Service
In a Crypto Pro Services update on October 15, 2025, our analyst showed this chart to subscribers and outlined a developing setup in MicroStrategy (MSTR).
Analysis/Forecast:
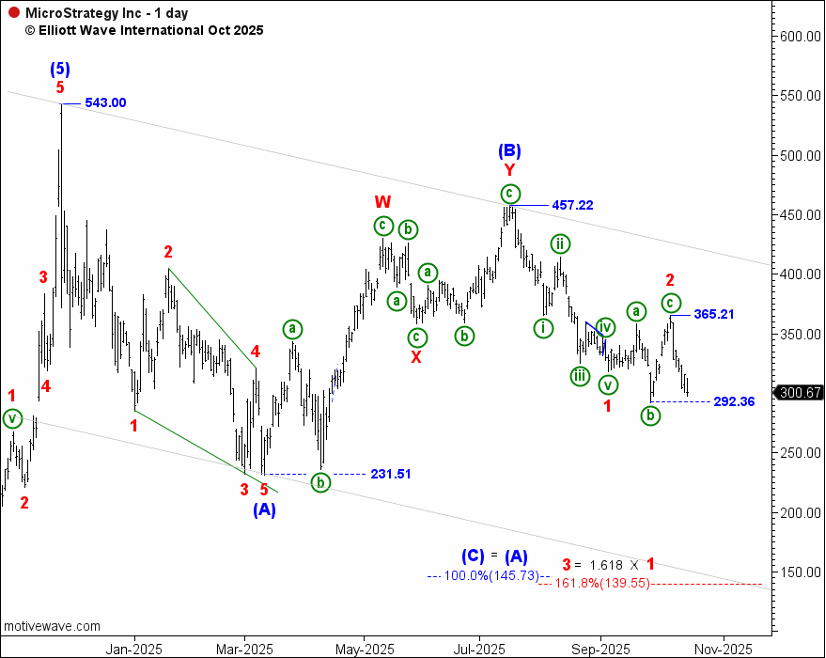
“Favoring that wave 2 ended at 365.21, we’re looking for a swift decline in five waves to complete wave 3.”
What Happened Next?
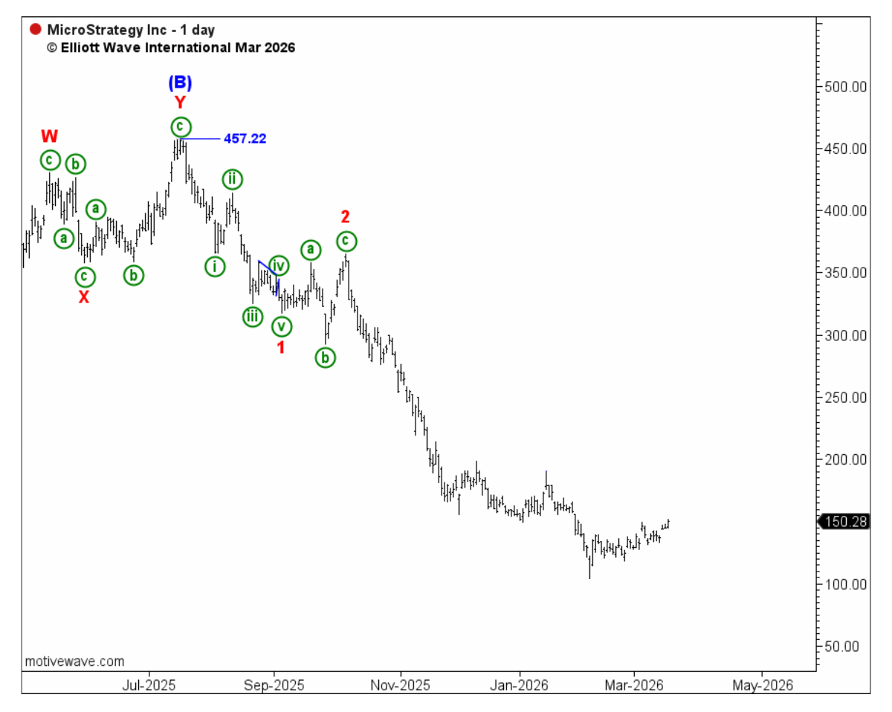
MicroStrategy declined sharply. At the time of the forecast, MSTR was trading near $300.67. As the wave structure unfolded, price declined to $104.17 by early February — a move of roughly 65%.
Interest Rates Pro Services
On February 27, 2026 our Interest Rates Pro Service analyst Ivo Zhelev identified a bearish triangle pattern developing in UK 10-year government bonds (gilts) — and highlighted a specific resistance zone near the (a)-(c) trendline where a reversal was likely. He showed this chart to subscribers and noted:
Analysis/Forecast:
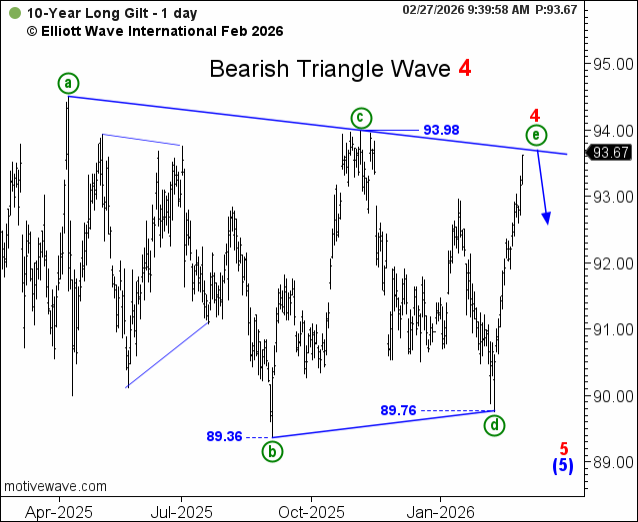
“… triangle thrusts often unfold as steep, swift declines once price breaks from the pattern.”
What Happened Next?
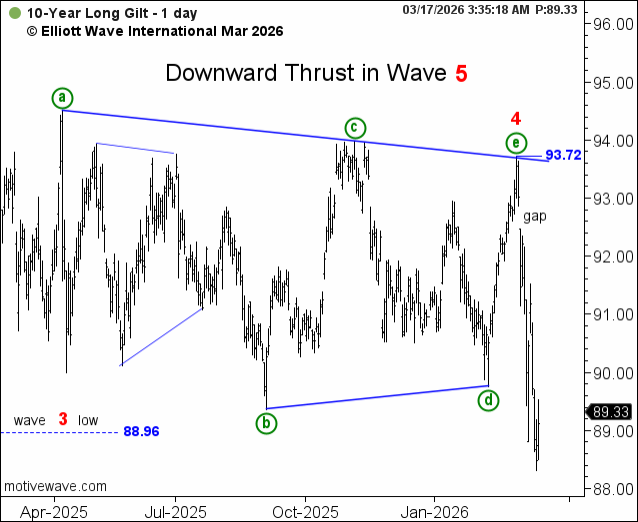
Gilts peaked on March 1 near the projected resistance area and then dropped sharply, quickly reaching — and satisfying — minimum downside expectations outlined in the forecast.
Currency Pro Service
On February 28, 2025, long before the “Liberation Day” tariffs, Currency Pro Service editor Michael Madden recorded a video for his subscribers with this chart and forecast for EUR/USD:
Analysis/Forecast:
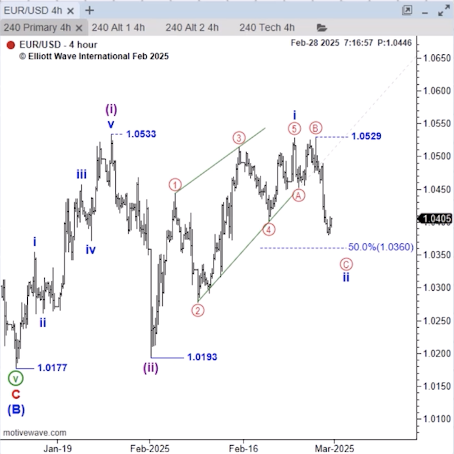
“5 waves down from 1.0529 will complete this pattern. From there, we’ll expect a dramatic reversal to kickstart a third-of-a-third advance.”
What Happened Next?
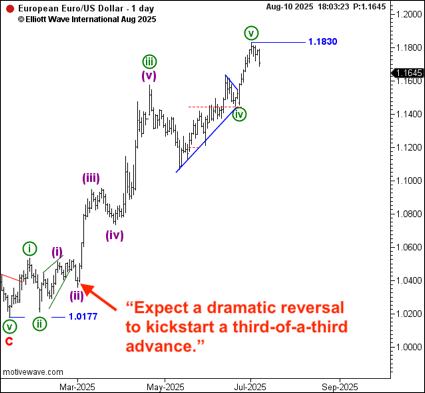
EUR/USD followed the Elliott wave script to perfection, reversing sharply and SKYROCKETING above $1.18 — a move of roughly+13%.
 Flash Services
Using EWAVES and its Wave Finder technology, Flash Services scan a broad universe of stocks, ETFs and futures to identify qualified Elliott wave setups. When confirmed by analysts, subscribers receive timely alerts with defined risk levels to monitor — without having to scan hundreds of charts themselves.
In March 2026, ETF Flash Service alerted subscribers to multiple setups in ProShares Ultra Bloomberg Natural Gas ETF as the waves unfolded:
Opportunity Alerts:
March 4 Alert — sent to subscribers at $17.36 and later concluded on March 9 at $20.60, as price moved +18.66%.
March 10 Alert — sent to subscribers at $17.92 and concluded on March 13 at $19.50, as price moved +8.82%.
March 16 Alert — sent to subscribers at $17.60 and concluded on March 19 at $18.96, as price moved +7.73%.
Result:
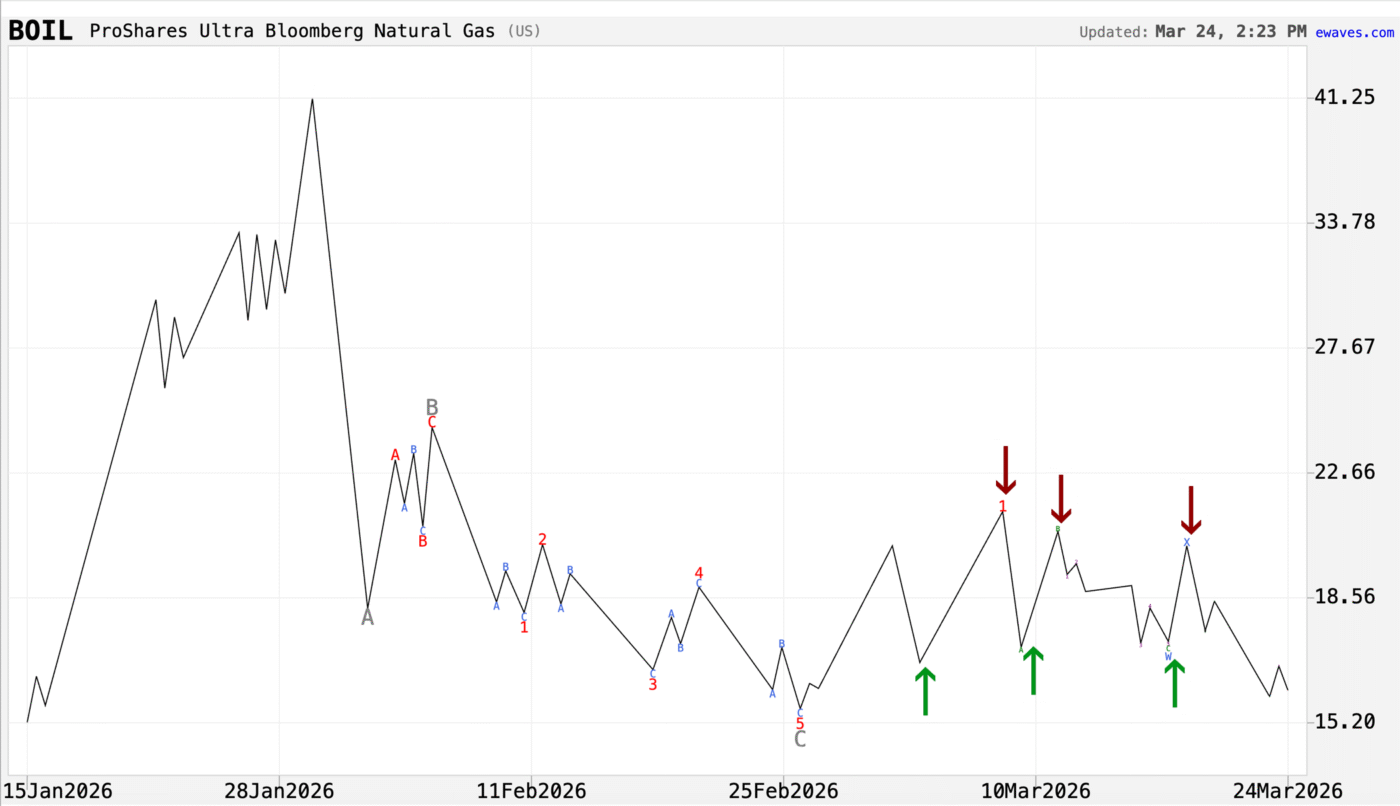
Combined, these sequential alerts represent a total move of +35% during the month of March alone as the developing wave structure progressed.
Intraday Stocks Pro Services
On April 2, 2026 while bearish sentiment was extreme and many expected lower prices, subscribers to Intraday Stocks Pro Services were shown a very different setup in the S&P 500. In his 3:35 p.m. intraday update, analyst Robert Kelley posted this chart and wrote:
Analysis/Forecast:
Intraday Update, April 2, 2026 (3:34PM):
“The larger count labels today’s low as the bottom of a second wave pullback. That’s due to the clear three-wave drop into today’s low.
If this count is right there will be a sizable advance next week. For now prices need to hold above 6501.90, the .786 retracement of wave iii so far, to keep this scenario in preferred status.”
What Happened Next?
The labeled wave ii low held. And prices exploded. From that April 2 low, the S&P 500 surged to 7123.76 — a move of roughly +8.8%, part of what Kelley called “one of the fastest rallies in history.”
Learn more about Pro Services >>
Elliott Wave Financial Forecast
As optimism toward the Robinhood Markets Inc. (HOOD) stock reached a new extreme in October 2025, analysis from our Elliott Wave Finanical Forecast identified signs that the rally was likely nearing completion.
Analysis/Forecast:
October 31, 2025:
“…the five-wave form of Robinhood’s rally to a new all-time high on October 6 suggests its latest rise is ending.
King Retail should quickly celebrate its latest position on top because it is all about to change.”
What Happened Next?
The warning proved timely:
By February 24, 2026, HOOD had declined to an intraday low of $69.22 — a drop of roughly 55% from the October peak.
Learn more about our Flagship Services >>
Short Term Update
In early October 2023, statistics showed that 90% of traders were bearish on gold. Our Flagship Short Term Update, however, had identified an “approaching wave 2 low” — signaling that a powerful wave 3 rally was likely next — and alerted subscribers to the opportunity.
Analysis/Forecast:
October 4, 2023:
“Gold’s steep decline hit $1815.00 yesterday, October 3, meeting the lower line of the zigzag channel formed by wave 2. If gold’s larger trend is bullish, that should be just about it for the selloff from the May 4 high. The DSI Indicator for gold (trade-futures.com) was at 11 last night after registering four days in a row of 8.”
What Happened Next?
Wave 2 had bottomed that very day:
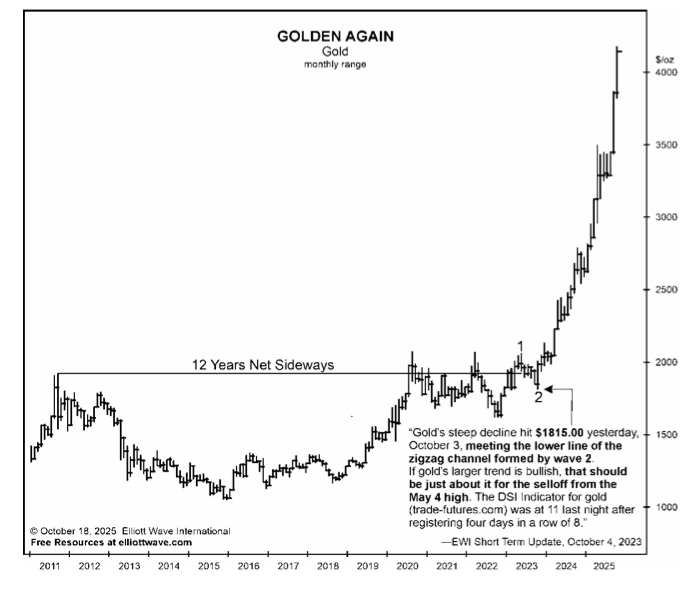
By October 2025, gold had traded above $4,000/ounce and later surged to a record high above $5,600 — nearly tripling as the larger bull market structure unfolded.
Learn more about our Flagship Services >>
Energy Pro Services
As February 2026 came to a close, crude oil was trading near $67/barrel. On February 27, EWI’s Energy Pro Service identified what appeared to be the completion of a wave (ii) pullback — a setup suggesting a powerful “third-of-a-third” advance was about to begin.
Analysis/Forecast:
Intraday Update, February 27:
“Crude should ratchet on up in third-of-a-third fashion.”
What Happened Next?
Just hours later came a 13% gap higher. Over the following days, crude accelerated almost vertically as wave iii unfolded, exploding above $115/barrel by March 8 — a rally of roughly +72% from the time of the forecast.
Learn more about our Energy Coverage >>
Commodity Junctures
In our February 2026 live webinar for Commodity Junctures subscribers, analyst Jim Martens walked subscribers through a developing setup in Cotton Futures that suggested the decline could be ending. The key pattern: an ending diagonal — an Elliott wave structure that often appears near major turning points. Jim walked through this chart and explained:
Analysis/Forecast:
February 19, 2026:
“It unfolded, I think, as an ending diagonal… as the name implies, a terminal movement…
Markets often offer second chances, and that’s what I how I look at this lower degree rally followed by a setback…Maybe the market’s giving you another opportunity, and now it’s time to think about being bullish against 63.64.”
What Happened Next?
At the time of the webinar, Cotton Futures was trading near 63.95. Over the following months, cotton rallied to nearly 90 — a move of roughly +40%.
Learn more about our Commodity Coverage >>
Flagship Services
IIn April of 2023, few investors were paying attention to silver. Our Flagship Services, however, were identifying the metal as one of the most overlooked opportunities in the financial markets.
Analysis/Forecast:
In April 2023, The Elliott Wave Theorist declared:
“Silver is probably the only commodity on earth selling for less than it did 43 years ago… Among all the world’s seasoned investments, it is the cheapest. Stocks are a religion. Property is a religion. Bitcoin is a religion. Nobody is paying attention to silver.”
One year later, in the April 2024 issue of The Elliott Wave Financial Forecast confirmed:
“Silver should trend with gold, and this week’s sharp advance indicates that prices are starting to align.”
Then in June 2025, EWT showed this chart and told subscribers of a “Major Spike Potential” in the metal:
What Happened Next?
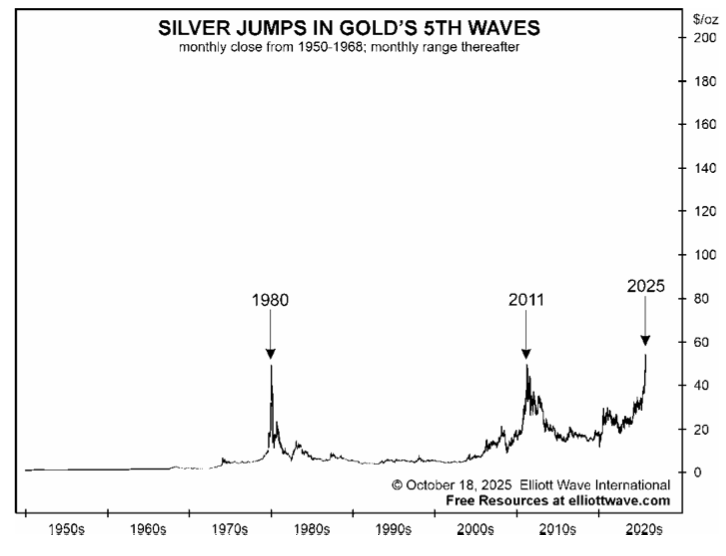
In October 2025, silver finally exceeded its 1980 all-time high, trading above $53/oz for the first time in more than four decades.
The breakout marked the beginning of a historic advance as silver eventually surged above $120/ounce in early 2026 — a move of roughly +400% from the time The Elliott Wave Theorist first highlighted the opportunity in April 2023.
Our forecasts were on this move early — and accurately.
Learn more about our Flagship Services >>
Crypto Junctures
In our live, February 2026 Crypto Junctures webinar our analyst examined Hyperliquid (HYPE). He walked through the pattern on the chart below and explained that the corrective pattern looked near or at completion — setting the stage for a potential move higher.
Analysis/Forecast:
February 24, 2026:
“I can make a decent case for the completion of the double zigzag… and then we’ll see a strong rally higher in red wave three.”
What Happened Next?
HYPE was $26.40 during the February 24 webinar. Less than a month later, it traded at $43.72 — a move of roughly +65%.
Learn more about Crypto Junctures >>
Global Market Perspective
In the April 2024 issue of Global Market Perspective, EWI Chief Asian and Emerging Markets Analyst Mark Galasiewski spotted a completed expanded flat pattern (highlighted in red on the chart below) in an Emerging Market Leader, Xiaomi Corp. He alerted his subscribers to the bullish setup:
Analysis/Forecast:
April 5, 2024:
“We think that the company’s shares completed a flat correction from their 2018 IPO to a low in October 2022 and since then are tracing out a series of first and second waves in a new impulsive advance.“
What Happened Next?
Xiaomi Corp. QUADRUPLED in a year!
Learn more about Global Market Perspective >>
Elliott Wave Trader’s Classroom
In early April 2026, Trader’s Classroom subscribers saw veteran Elliott wave instructor Tony Carrion examined the wave structure in Semiconductor ETF (SMH). Tony argued the decline appeared corrective — more consistent with fourth-wave behavior. His conclusion: higher highs were still likely ahead.
Analysis/Forecast:
April 6, 2026:
“The question right now is whether or not all the five waves are in place for us to consider this bull market has peaked. So, to me it hasn’t... That the correction that we’ve been getting over the past few months is what looks to me to be fourth-wave price action.“
“To sum up quickly, I think the wave patterns are saying there should probably be one more run to chase the all-time high.”
What Happened Next?
By April 24, SMH rallied roughly +30% to a new all-time high.
Learn more about Trader’s Classroom >>
Crypto Pro Service
In a Crypto Pro Services update on October 15, 2025, our analyst showed this chart to subscribers and outlined a developing setup in MicroStrategy (MSTR).
Analysis/Forecast:
October 15, 2025:
“Favoring that wave 2 ended at 365.21, we’re looking for a swift decline in five waves to complete wave 3.”
What Happened Next?
MicroStrategy declined sharply. At the time of the forecast, MSTR was trading near $300.67. As the wave structure unfolded, price declined to $104.17 by early February — a move of roughly 65%.
Learn more about our Crypto Coverage >>
Interest Rates Pro Services
On February 27, 2026 our Interest Rates Pro Service analyst Ivo Zhelev identified a bearish triangle pattern developing in UK 10-year government bonds (gilts) — and highlighted a specific resistance zone near the (a)-(c) trendline where a reversal was likely. He showed this chart to subscribers and noted:
Analysis/Forecast:
February 27, 2026:
“… triangle thrusts often unfold as steep, swift declines once price breaks from the pattern.”
What Happened Next?
Gilts peaked on March 1 near the projected resistance area and then dropped sharply, quickly reaching — and satisfying — minimum downside expectations outlined in the forecast.
Learn more about our Interest Rates Coverage >>
Currency Pro Service
On February 28, 2025, long before the “Liberation Day” tariffs, Currency Pro Service editor Michael Madden recorded a video for his subscribers with this chart and forecast for EUR/USD:
Analysis/Forecast:
February 28, 2025:
“5 waves down from 1.0529 will complete this pattern. From there, we’ll expect a dramatic reversal to kickstart a third-of-a-third advance.“
What Happened Next?
EUR/USD followed the Elliott wave script to perfection, reversing sharply and SKYROCKETING above $1.18 — a move of roughly+13%.
Learn more about our Currency Coverage >>
Flash Services
Using EWAVES and its Wave Finder technology, Flash Services scan a broad universe of stocks, ETFs and futures to identify qualified Elliott wave setups. When confirmed by analysts, subscribers receive timely alerts with defined risk levels to monitor — without having to scan hundreds of charts themselves.
In March 2026, ETF Flash Service alerted subscribers to multiple setups in ProShares Ultra Bloomberg Natural Gas ETF as the waves unfolded:
Opportunity Alerts:
March 4 Alert — sent to subscribers at $17.36 and later concluded on March 9 at $20.60, as price moved +18.66%.
March 10 Alert — sent to subscribers at $17.92 and concluded on March 13 at $19.50, as price moved +8.82%.
March 16 Alert — sent to subscribers at $17.60 and concluded on March 19 at $18.96, as price moved +7.73%.
Result:
Combined, these sequential alerts represent a total move of +35% during the month of March alone as the developing wave structure progressed.
Learn more about Flash Services >>
EWI’s Research is Trusted by Thousands of Independent Investors and Market Professionals at the World’s Largest Institutions