Halloween greetings from Murray Gunn:
The chart below should give a fright to bulls of the stock market.
It shows the Shiller Cyclically Adjusted Price Earnings Ratio (CAPE) for the U.S. stock market. The current reading is 39.5. This is the second highest reading in the history of the data going back to 1881, just below the all-time peak of 44.2 at the start of the new millennium. Even in 1929, just before the most famous stock market crash, CAPE only got to 32.5.
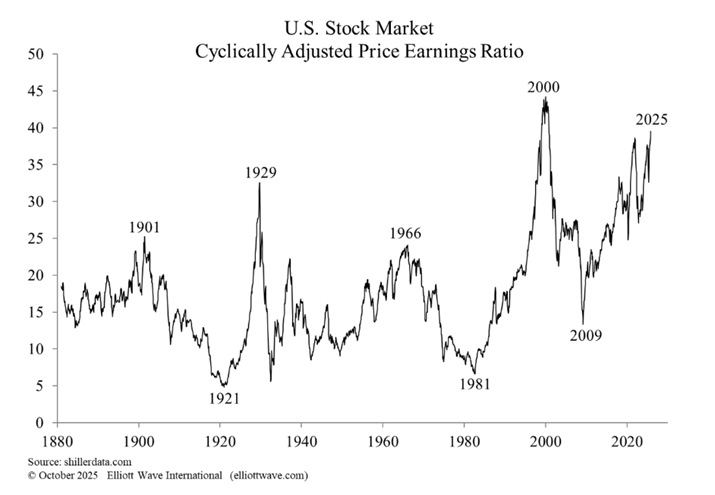
Of course, there’s no reason why earnings can’t explode higher rather than share prices decline in order for CAPE to fall back. AI bulls think that way. But if history is a guide, this overvaluation of the U.S. stock market will be corrected by a grizzly bear market in stocks.
If you are prepared, it shouldn’t be a horror show.
This is just one of many warning signs flashing across financial markets.
Discover the full picture in our FREE report: “18 Flashing Red Signals.”
Or, stay ahead of the next market turn by subscribing now to our Global Market Perspective.