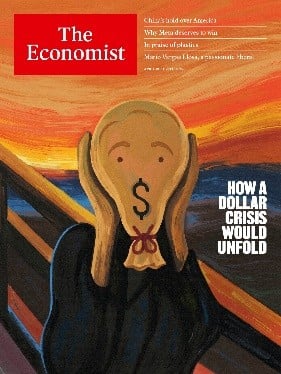
On April 19th of this year, The Economist magazine ran a cover depicting Edvard Munch’s “The Scream.” But in place of a mouth in an open scream, the painting’s anguished face portrayed …
… A dollar sign. The accompanying title was: “How a Dollar Crisis Would Unfold”.
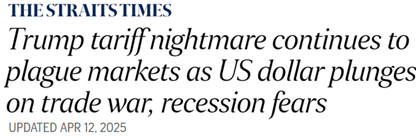
At a glance this cover story seemed timely. The U.S. Dollar Index (dollar relative to a basket of other currencies) had trended sharply downward since mid-January. On April 21st the index fell below 98, a three-year low. News coverage at the time freely blended politics and finance into a narrative about a “tariff nightmare” driving the buck lower; this Economist magazine cover was one conspicuous example among many.
But was the decline into April an actual “Crisis” for the dollar?
We raise the question because only six months earlier (Oct. 19th 2024), The Economist ran a dollar-related cover story with a very different theme – namely, that the greenback was blasting upward as “The Envy of the World.”
Thus one Economist cover expected an upward long-term dollar trend, the other expected a downward long-term trend. That’s a hard difference to reconcile in a six-month time window.
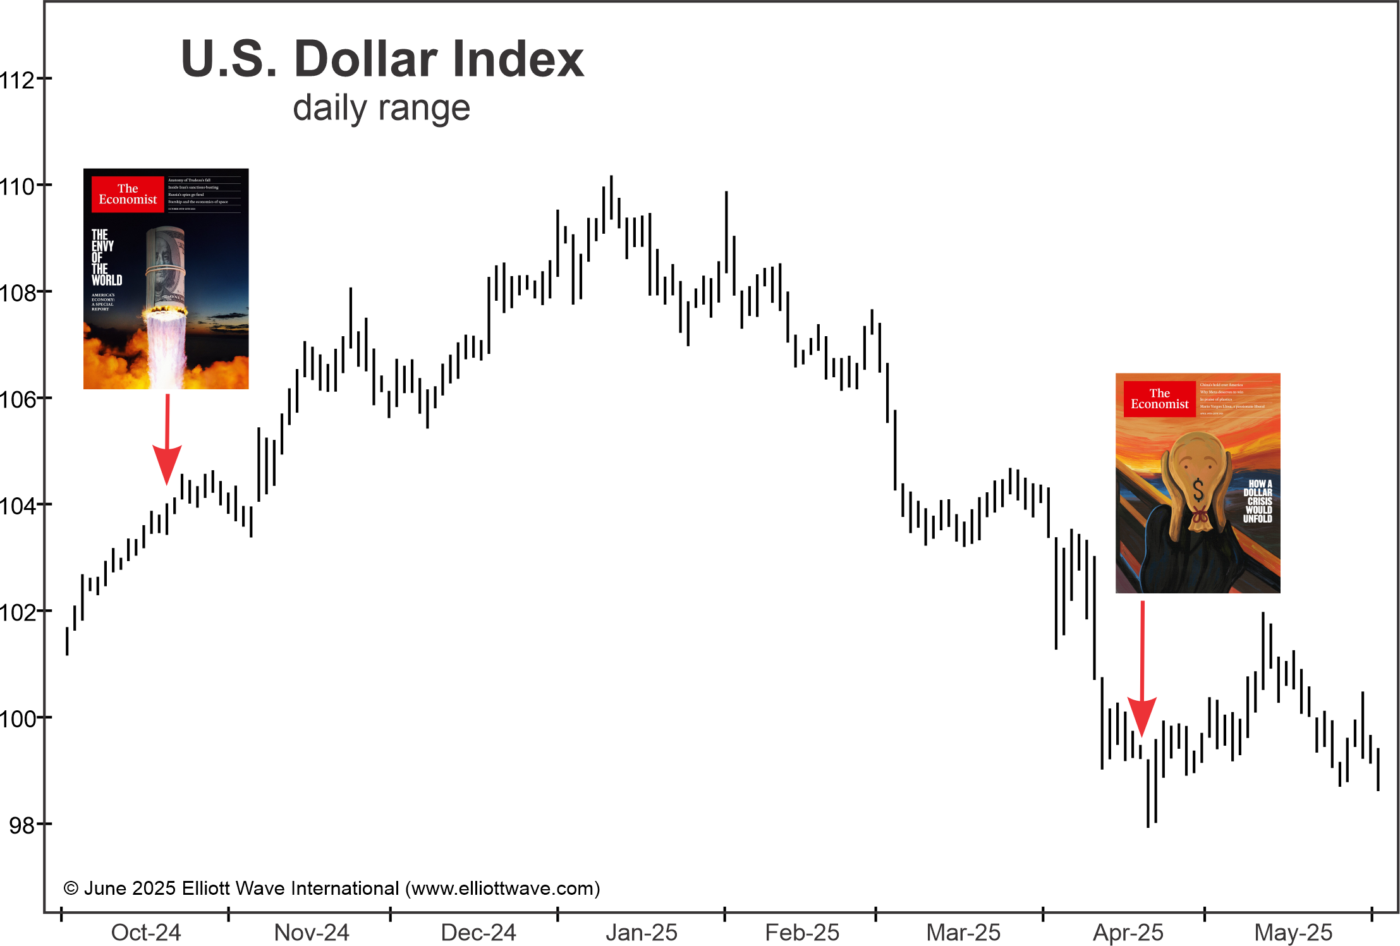
We can simply echo the late market savant Paul Montgomery, who observed that a financial trend strong enough to make a major news weekly cover is usually near a reversal. In other words, magazine covers about financial trends often prove to be contrary indicators.
The chart below shows that, unlike news-driven media narratives, our Elliott wave analysis did indeed forecast the end of the rally in January and the fast decline that followed.
On December 2nd we showed subscribers a version of the chart below, with directional arrows showing that index would rise above 108 and turn lower. The chart headline said, “One More High For The Buck.” Our forecast on December 6th said:
“The index is in the late stages of wave (B) … wave (C) will then be a five wave decline that draws the index below [99.578].”
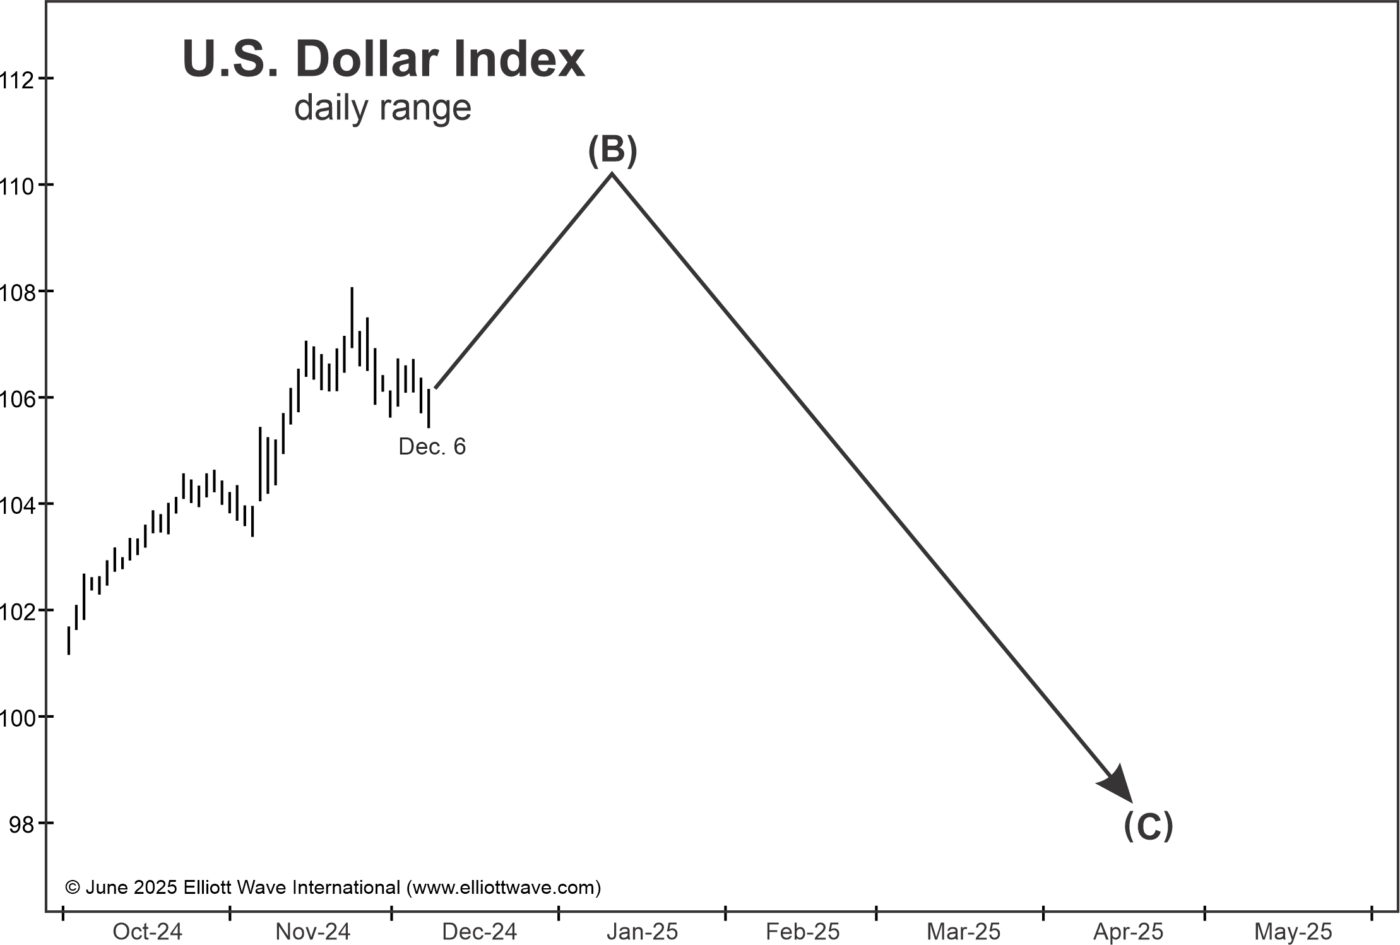
In other words, the Dollar Index was near a reversal. The “late stages” of the trend carried into January as the Dollar Index carried above 108 and reached its highest level in two-plus years.
This next chart shows the before and after. On January 13th we showed that from the September 27th low a five-wave Elliott pattern was in place. Our commentary that day said the next major move “will be a multi-month decline that draws the index below 99.578.”
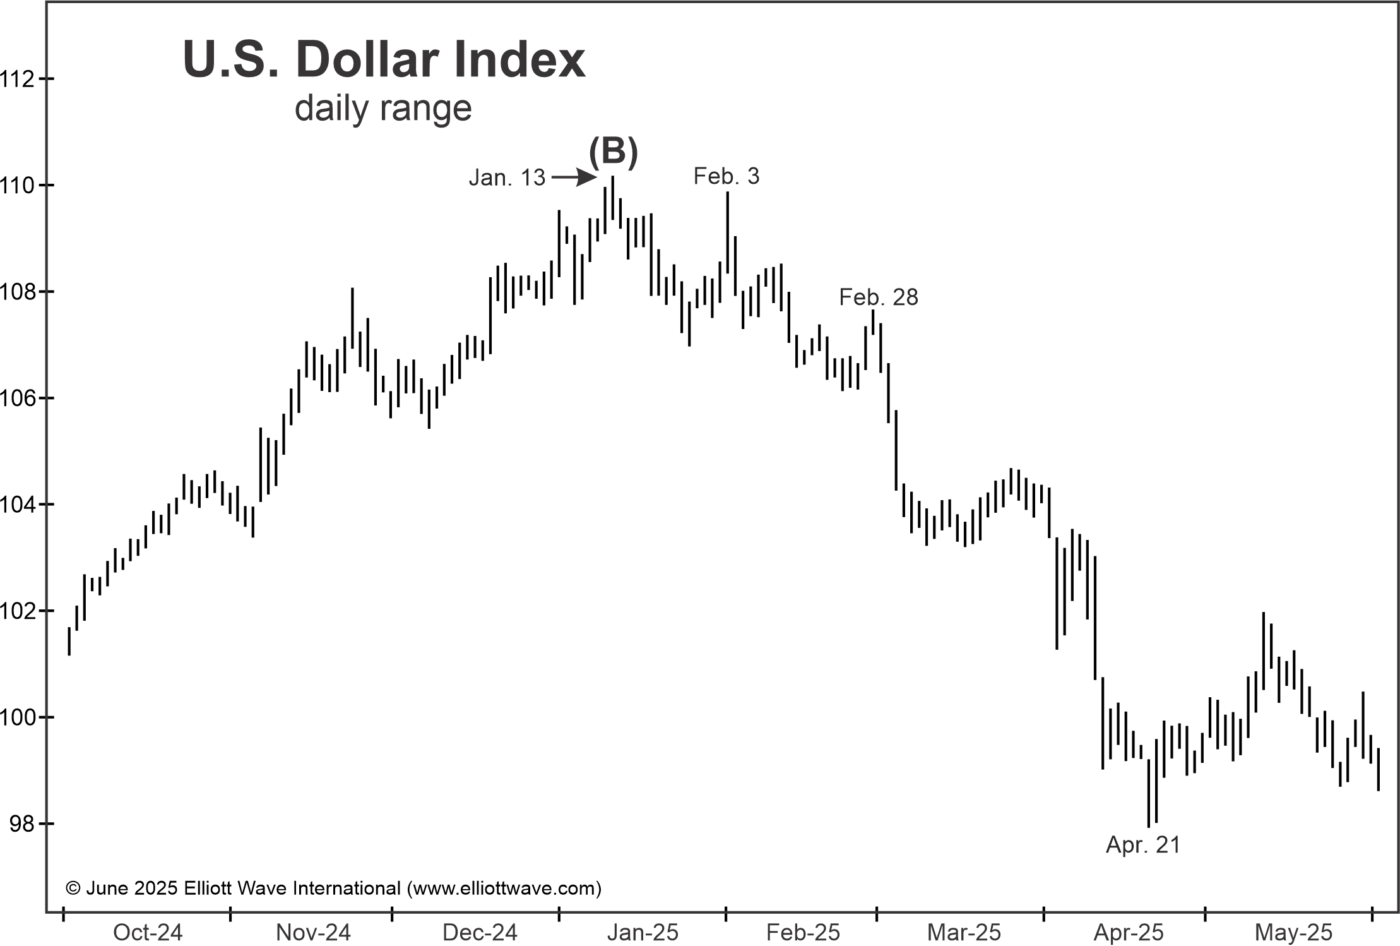
Price did turn quickly lower, but saw a strong bounce into February 3rd. Yet our analysis that day was clear: We said, “The high on January 13 … remains intact and so does our bearish stance.”
Again the trend lower resumed and then saw a bounce at the end of February. Our forecast on February 28 told subscribers that,
“The rally over the past three days is a normal upward retracement in the downtrend. Once complete, [the downtrend] will draw the U.S. dollar significantly lower.”
A series of sharply lower moves followed that carried into April 21st. Our commentary that day said “the U.S. Dollar Index is approaching a low.” In fact that day was the low, and a three-week rally followed.
Don’t rely on upside-down media narratives that project yesterday’s trend into tomorrow.
Not all forecasts work out the way our Dollar Index analysis has. That said, our monthly Financial Forecast and 3x-per-week Short Term Update continue to track this same Elliott wave pattern, which anticipated these earlier trends and turns before they unfolded. Follow the link below for more information.